
Following the footsteps of the Regional Snowfall Index (RSI), the Regional Flooding Index (RFI) ranks flooding impacts on a scale from 1 to 5, similar to the Fujita/Enhanced Fujita scale for tornadoes or the Saffir-Simpson scale for hurricanes. The index utilizes three different data sources: river gauges provided by USGS, precipitation estimates from the multi-radar multi-sensor (MRMS) product, and VIIRS flood composites the SNPP and NOAA-20 polar orbiting satellites. In addition, socioeconomic data is taken into account, including population data from the US Census Bureau. RFI is based on the spatial extent of the event, the amount of flooding, and the juxtaposition of these elements with population and societal impacts.The end goal is a cloud-ready, interactive GIS portal displaying these events alongside additional vulnerability information at the local level. This presentation will go into more detail about the methodology in building the RFI, and provide case studies of relevant events. 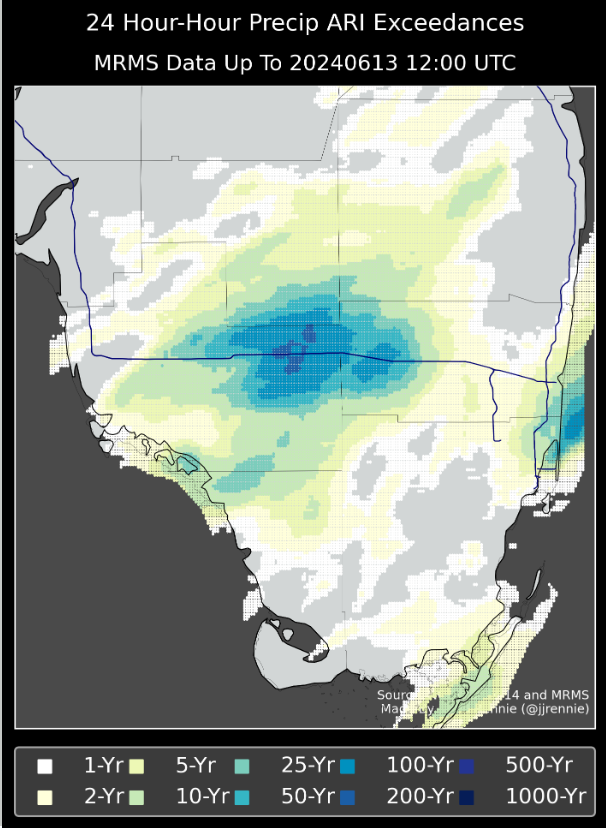
 - Indicates paper has been withdrawn from meeting
 - Indicates an Award Winner