
The following steps were executed. First, the hourly wind observations were reduced into north/south (“v”) and east/west (“u”) components, creating a rectangular array of N by 48 cases, where N is the number of complete original daily hourly observations and 48 the number of “u” and “v” parameter values (i.e., 24 pairs of “u”’s and “v”’s). The u's and v's were all reduced to a common scale relative to one another or "standardized". Selecting the "Squared-Euclidean" distance statistic, the K-Means clustering routine was then run, integrated with the V-fold cross validation algorithm which produced an “optimal” number of “K” clusters resident in 48-dimensional space. Each of the 48-D "u"/"v" cluster centroids were then transformed via the arctangent function into arrays of hour-to-hour diurnal resultant wind directions, matched up on a one-on-one basis with their corresponding cluster mean scalar wind speeds. The finished results, presented in tables as mean vector wind directions, mean scalar wind speeds, vector wind constancies, and percent cluster frequencies at half-month intervals, together with supporting graphics, revealed distinct and physically meaningful patterns, the n=24 half-month climatological frequencies also displaying mostly smooth progressions over the calendar year. Three such modes were generated for Las Vegas and four each for Phoenix and Tucson, the self-contained arrays of 24 adjacent hours’ statistics enabling quick-study aggregate interpretations and comparisons. Implicit in the results was that the principal climatological wind directional patterns of the stations had not changed significantly over their seventy-year-plus periods- of-record.
Such a methodology, utilizing manipulated "u" and "v" wind components in a clustering analysis might be considered as an alternative or complementary tool to wind rose diagrams, since it can elucidate and condense relevant information of many different wind roses into compact tabular and graphical formats.
Another topic covered is identification of extreme-most diurnal patterns overall. As a standard output feature, the K-Means routine produces statistical distances (in this application, "Squared Euclidean") of each observation from its ‘kth’ cluster centroid. However, such distances are just “local”, pertaining only to the particular cluster concerned and not of paramount importance in the overall sense. However, “global” statistical distances, those produced if the observations are not clustered (i.e., a “forced” k=1 treatment) could be fashioned heuristically as a statistic for the data set as a whole, pinpointing extreme-most daily patterns, a sort of spin-off exercise relative to the more nominal type K-Means decompositions described above. Employing this method, single-most extreme diurnal wind patterns are identified for each of the three stations. Extreme-level K=1 distances for hourly wind data can be enhanced by anomalously large standardized u and v magnitudes (i.e., reflecting high wind speeds), unusual u and v combinations (i.e., reflecting wind direction anomalies), and uncommon combinations of both wind speeds and directions at atypical hours of the day.
A similar type treatment utilizing K=1 distances was demonstrated for Los Angeles and San Francisco hourly temperature and monthly precipitation data [Fisk, 2024].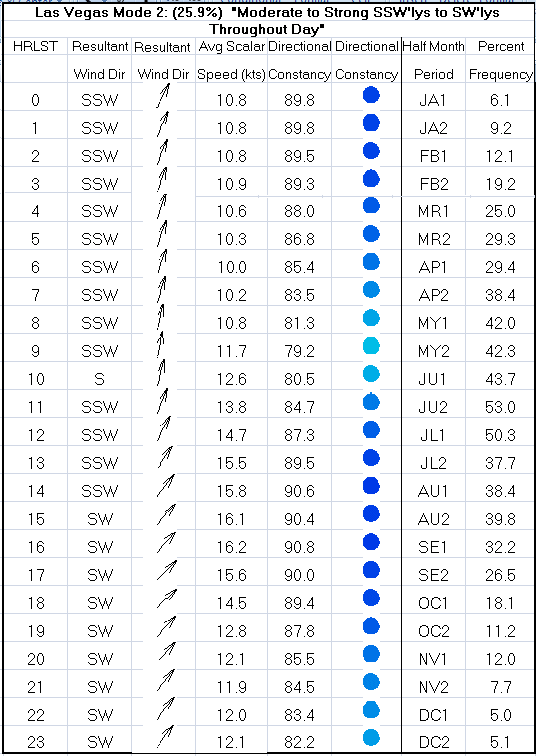
 - Indicates paper has been withdrawn from meeting
 - Indicates an Award Winner