
The urban heat island effect (UHIE) whereby temperatures in the “urban area” are higher than those of the surrounding “rural area” has been an active area of research due to the societal impact related to the lasting negative impacts on people and the economy (Deilami et al. 2018). The terms “urban” and “rural” are limiting because within a city there are unique physical properties which contribute to the creation of discrete micro-climates/intra-UHIs (Hong et al. 2018). Although the broad-scale magnitude of the urban-rural temperature differences/UHII have been studied extensively, less is known about the thermal heterogeneity within cities at the local/neighborhood-scale (Kim and Brown 2021). To understand the micro-climate/intra-UHIE we have evaluated the neighborhood-scale thermal/environmental signatures in-and-around the city-center of Albuquerque NM.
2. METHODOLOGY
Albuquerque NM, a southwestern US city, hosts a population of 562,336 people covering a land area of 187.219 square miles. The high desert climate is arid, e.g., hot summers/cool winters and low precipitation ~11-inches/year. Albuquerque has experienced significant urban-sprawl over the last 5-decades which has created many discrete population-centers with distinct micro-environments within the city.
Since Albuquerque is one of the top 10-cities in the US experiencing the UHIE, CAPA Strategies conducted a broad-scale/city-wide thermal mapping campaign in July 2021. Results of this 1-day mapping campaign revealed three important findings, namely a maximum temperature of 105.9oF, a maximum temperature differential/UHII of 16oF and most importantly revealed that the city is composed of a multitude of micro-climates/intra-UHI (CAPA Strategies, LLC 2021).
Guided by CAPA’s results our study was designed to assess the nature, characteristics, and societal impact of the neighborhood-scale intra-UHI near Albuquerque’s city-center. The city-center comprises a business district (restaurants/shops/gallery’s), a train/bus station, 2-schools, 2-hospitals, and interspersed residential-neighborhoods (low-income apartment-clusters and one high-income neighborhood). The mobile-transect method, walking a 2.5-mile closed-loop path, was used to obtain pedestrian-level air temperatures/TAIR, particulate matter levels, PM(1.0,2.5,10.0-μm), and meta-data. The data was collected via an AirBeam solar-radiation-shielded hand-held air-sensor. A Kestrel-3000 sensor (ground-truth/TAIR) was used for temperature calibration. The corrected temperatures were obtained utilizing the Kestrel data in combination with a mathematical model employing a second-order polynomial curve-fitting protocol. The study covered 7-weeks, (May 19-July 3, 2024) with measurements taken twice-per-week at 3-distinct times/day (morning/7-8am, afternoon/2-3pm, evening/7-8pm). A Hobo stationary external-temperature/RH data-logger, located in a non-urban area, provided the rural temperature-values for calculating the UHII.
3. RESULTS AND DISCUSSION
This study was designed to answer 3 research questions/RQ:
(RQ1): What is the behavior of the thermal-signature in the time-domain and does the TAIR exhibit thermal-variance at the “neighborhood scale” along the transect path?
(RQ2): What is the behavior of PM(1.0,2.5,10.0-μm) in the time-domain and does its distribution vary on the neighborhood-scale?
(RQ3): Are there neighborhood-scale societal impacts related to our findings?
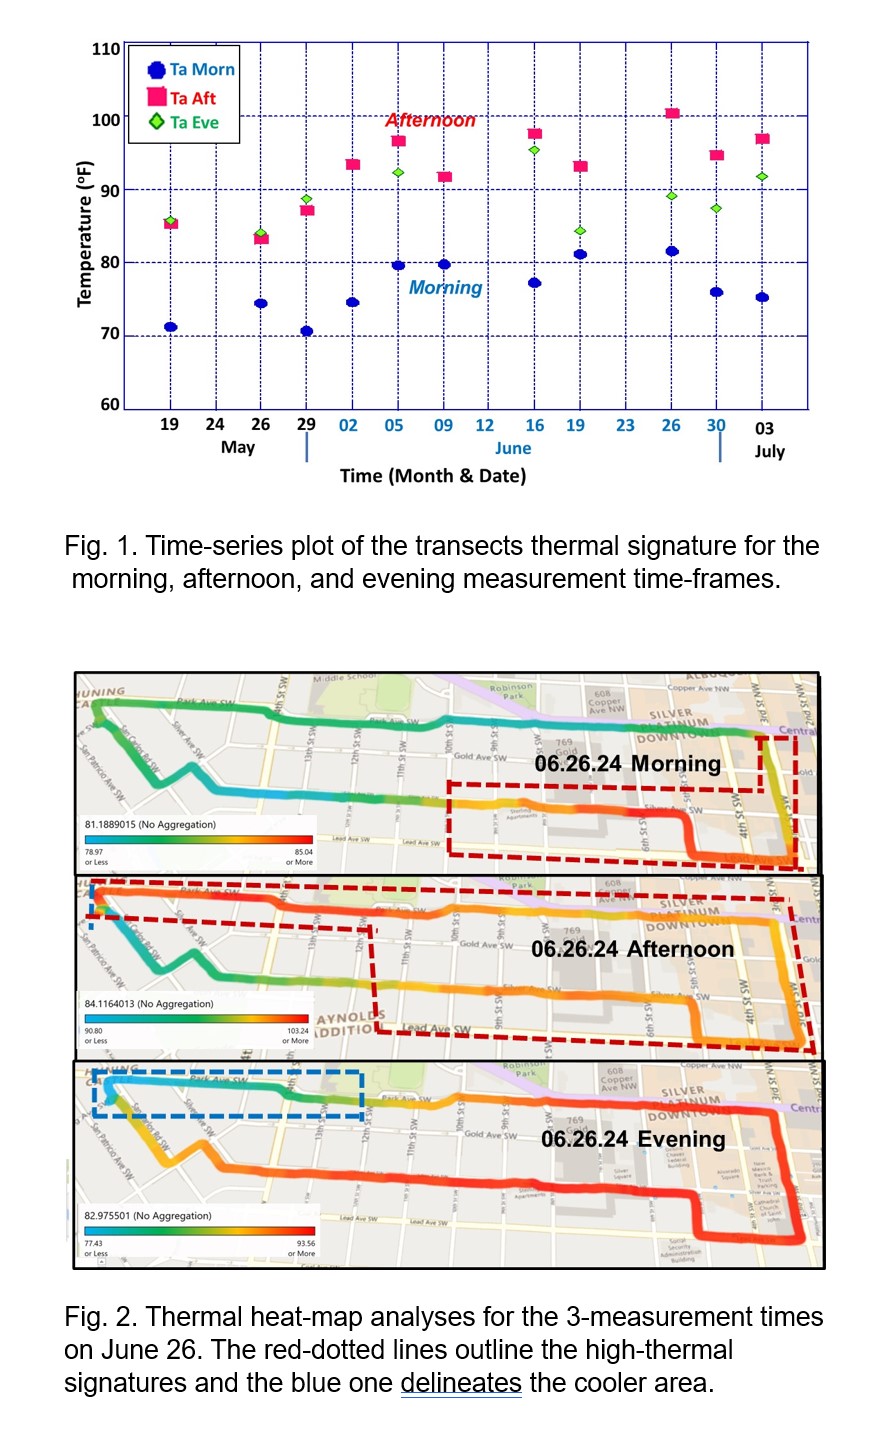
Fig 1 displays a time-series plot of the transects thermal-signature, at the 3-times/day, over the data collection period. For all measured days the highest temperatures occurred the afternoon and the lowest were observed in the morning. The hottest and coolest days were approximately 1-month apart, June 26 (TAfternoon~100.5 oF) and May 26 (TAfternoon~ 83.2 oF), respectively. Across the time-series, from May-July, the range between the coolest-hottest temperatures became more pounced/widened.
To understand the neighborhood-scale TAIR behavior (RQ1), transect-thermal/(TAIR) heat-maps for the morning, afternoon and evening were constructed for the study’s hottest day/June 26 (Fig. 2). The heat-map analyses, for all measurement times, revealed a notable thermal/TAIR variance as a function of position along the transect path. In the morning, the highest thermal signature (~85oF) was localized in the downtown-area and within-and-around the apartment-cluster (characterized by hard-scape/minimal green-space) near the city-center. In the afternoon, the TAIR increased in magnitude (~103oF) and became widespread along the transect-path with only a small localized residential-area remaining ~13oF cooler. The evening thermal-signatures paralleled those of the afternoon, however a small tree-lined residential pathway exhibited cooler temperatures, ~77oF. The UHII was calculated for the 3-daily measurement times over the data collection time-period. The highest UHII-values were observed in the evening (~14.5oF) and the morning (12.9oF). Although lower in magnitude, these results are temporally consistent with CAPAs city-scale UHII-values.
To address RQ 2 and 3, a time-series analyses of the transects PM-signature, at the 3-times/day, over the data collection time-period was constructed/analyzed. Results revealed that although PM(1.0,2.5,10.0-μm), were present throughout the time-domain, the PM-concentration was low, <25 ug/m3. PM2.5 heat-maps for the 3-measurement times on June 26 revealed negligible amounts of PM2.5 along the transect in the morning. In the afternoon the PM2.5 was broadly-distributed along the entire transect, however in the evening the PM2.5 was concentrated in the city-center and near the apartment-cluster situated along a moderate-traffic-roadway. No neighborhood-scale correlation between the PM and thermal-signatures were observed in the time and/or geospatial domains.
The hotter conditions, associated with the intra-UHI, intersect with other risk factors which promote negative societal impacts. Our work, combined with the NM Department-of-Health/NMDOH data-base, demonstrated that the heat-related emergency-room/ER visits were positively correlated with the elevated thermal-signatures observed in our study. This suggests that residents of hot-micro-climates are likely to experience heat-related illness.
4. CONCLUSIONS
Our results determined the nature/characteristics of neighborhood-scale micro-climate of Albuquerque’s city-center. Evidence, obtained via mobile-transect surveys, revealed a large variance in magnitude and range/extent of the thermal and PM signatures as a function of time of day and geospatial position along the transect-path. The neighborhood-scale UHII was found to be lower in magnitude, but temporally consistent with CAPAs city-scale mapping campaign. The elevated thermal-signatures were positively correlated with heat-related ER visits.
References
CAPA Strategies, 2021: Albuquerque NM Heat Watch Report.
Deilami, K., Kamruzzaman, M.D., Liu, Y., 2018: Urban heat island effect: A systematic review of spatio-temporal factors, data, methods, mitigation measures. Inter. J. of Appl. Earth Observation and Geoinformation, 67, 30-42.
Hong, J., Cui. P., Wong. N. H., Ignatius, N. 2018: Assessing the effects of urban morphology-parameters on microclimate in Singapore to control the urban heat island effect, Sustainability, MDPI, 10, 1-18.
Kim, S.W., Brown, R.D. 2021: Urban heat island intensity and magnitude estimations: A systematic literature review, Sci. Total Environ. 779, 146389.
 - Indicates paper has been withdrawn from meeting
 - Indicates an Award Winner