
While the operational versions of CIP and FIP produce output on a 13-km grid, experimental versions at the National Center for Atmospheric Research (NCAR) produce 3-km output and include a number of algorithmic enhancements to provide more accurate products better aligned with state-of-the-art understanding of cloud and precipitation microphysics. This presentation outlines the recent major advancements in CIP and FIP and performance of the output. Algorithmic advancements include a restructuring of the decision tree underlying CIP and FIP to better align with established mechanisms for the formation of SLD conditions. Expanded drop size guidance includes the addition of Freezing Rain (FZRA) Potential which estimates the likelihood of SLD conditions with DMax > 500 um. The addition of FZRA Potential also allows for a the derivation of a drop size category which combines Icing Probability, SLD Potential, and FZRA Potential to classify areas as no icing, small drop icing (DMax < 100 um), FZDZ (100 um <= DMax <= 500 um), or FZRA (DMax > 500 um).
The performance of these experimental versions of CIP and FIP is presented by leveraging in situ aircraft observations from the 2019 ICICLE field campaign and the 2022 WINTRE-MIX and TAIWIN Demonstration field campaigns. For example, Figure 1 shows receiver operating characteristic curves for Icing Probability, SLD Potential and FZRA Potential as the threshold defining a positive icing/SLD/FZRA diagnosis/forecast from CIP/FIP is varied. CIP generally performs better than FIP due to the inclusion of observations. This is especially true for SLD Potential which highlights the difficulty in predicting FZDZ specifically from NWP alone.
Figure 1: Receiver operating characteristic curves showing the probability of detection and probability of false detection for CIP (left) and FIP (right) outputs as the threshold for defining a positive icing diagnosis/forecast is varied. The area under each curve (AUC) is noted in the legend. A perfect algorithm reaches the top left corner and has an AUC of 1.
This material is based upon work supported by the National Center for Atmospheric Research, which is a major facility sponsored by the National Science Foundation under Cooperative Agreement No. 1852977. A portion of this research is in response to requirements and funding by the Federal Aviation Administration (FAA). The views expressed are those of the authors and do not necessarily represent the official policy or position of the FAA. 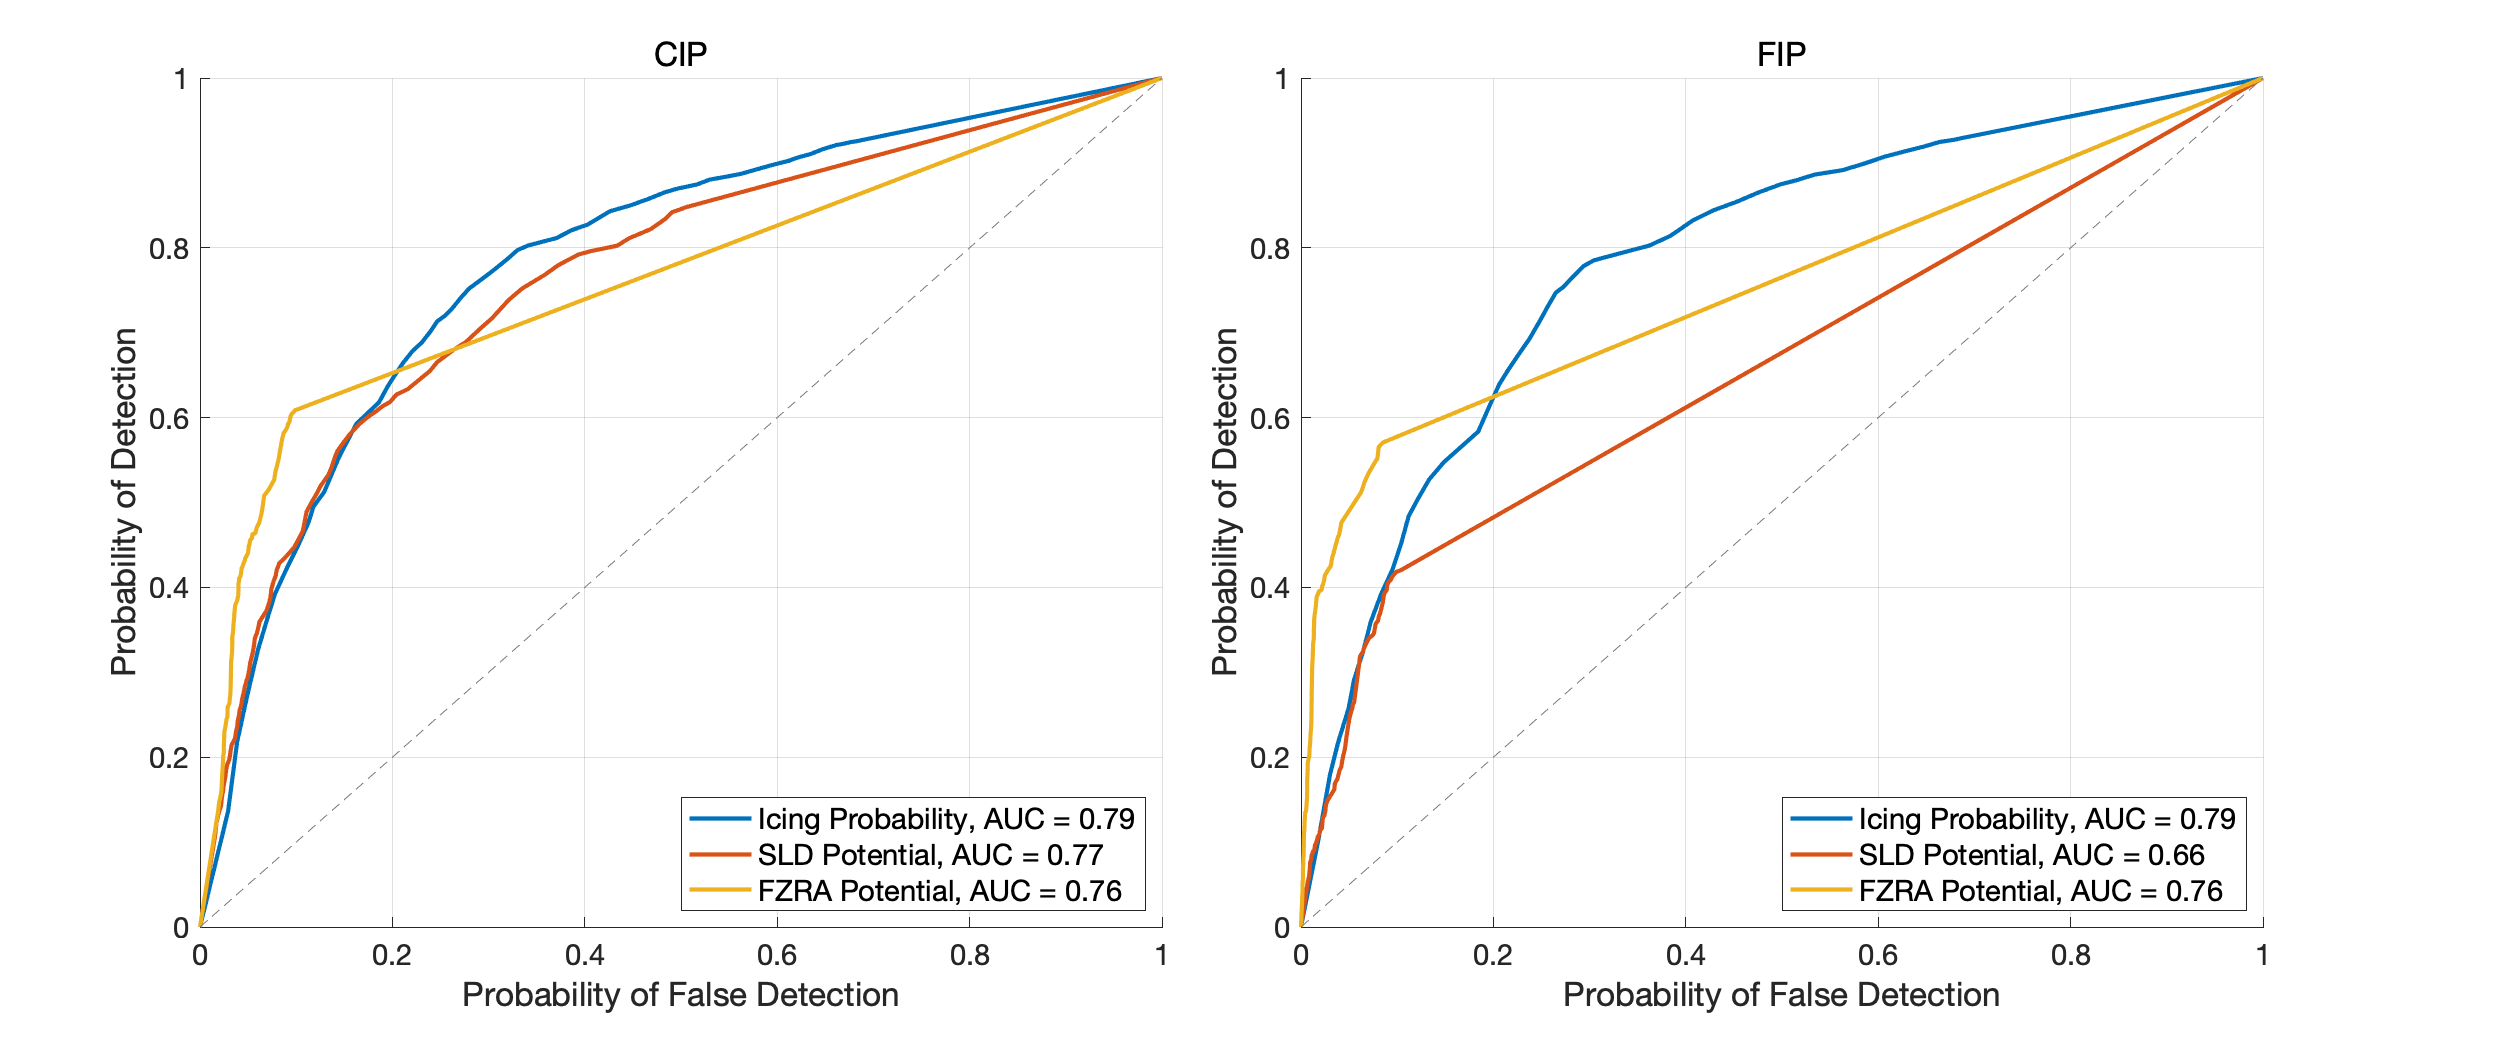
 - Indicates paper has been withdrawn from meeting
 - Indicates an Award Winner