
One field test case includes large waves, very low sea ice concentrations in the locations of the buoy deployments, and collinear winds and waves entering the MIZ. In the second test case, waves are more moderate, and MIZ ice concentrations are higher, up to about 40% in areas of buoy deployments. The latter case also involves crosswinds to the waves after they move in the MIZ. With respect to the two field test cases, scatterplots for significant wave heights, Hs, related statistical indices do not give a clear, unequivocal indication for the leading performers, among the wave-ice models considered in this study. Additional calculations for 1-D attenuation and related statistical estimates for error and correlation coefficients suggest that a ‘best performer’ is one of the new wave-ice parameterizations, with respect to the buoy observations, denoted the MBS’ model, which is originally based on Meylan and Bennetts (2018), Meylan et al. (1997) and Meylan and Squire (1996).
Factors that make this study challenging are the availability of high-quality field data for sea ice and winds to drive the models for wave-ice interactions over the large domains needed to track the wave processes during storm events. One characteristic motivating this study and emerging from the Sea State Experiment, is the fact that waves propagating from open ocean into MIZ sea ice are usually approaching the ice edge at a ‘slanting’ angle. That is the common experience in field observations. In fact it would be unusual for the waves to impact the MIZ at precisely 90o. We found one feature that was common to all the model simulations using hypothetical rectangular ocean tests, as well as observations collected during a ‘slanting’ test case from the Sea State experiment. It is that waves propagating into the MIZ on a ‘slanting’ fetch angle tend to veer towards normal to the ice edge, rotating clockwise as they enter the MIZ and attenuate, in the cases presented in this study. This is presented in Figure 1 for model simulations, and also verified from analysis of the 2D SWIFT buoy observations. Moreover, results from the hypothetical rectangular ocean suggest the formation of an ‘interaction zone’ or ‘interaction front’ in the MIZ, where ‘incoming waves’ interact with local ‘wind-generated’ waves, depending on attenuation characteristics of the wave-ice model, wind forcing and ice conditions.
In summary, the development of predictive models for wave ice interactions requires that any models be carefully calibrated against measured data. The most effective way to accomplish this is to use highly developed wave forecast codes such as WW3. We have shown that for the highly sophisticated three-dimensional wave – ice scattering methods, such comparisons are possible. However, the task of data comparison is far from straightforward. In particular, the experiments need to be performed close to the ice edge where the most significant variability in sea ice conditions is present. For any such studies, it is crucial to have reliable estimates for the winds and ice. However, the uncertainly in ice properties and in the winds over the MIZ, as well as the assumptions made of physical parameterizations used in wave-ice models themselves, create considerable variations in the model outputs and performance, and these factors present challenges for the interpretation of the results.
References
Meylan, M. H., & Bennetts, L. (2018). Three-dimensional time-domain scattering of waves in the marginal ice zone. Phil. Trans. Roy. Soc. doi:10.1098/rsta.2017.0334
Meylan, M. H., Perrie, W. et al. (2020). On the three-dimensional scattering of waves by flexible marginal ice floes. JGR. https://doi.org/10.1029/2019JC015868
Meylan, M. H., & Squire, V. A. (1996). Response of a circular ice floe to ocean waves. JGR. https://doi.org/10.1029/95JC03706
Meylan, M. H., Squire, V. A. et al. (1997). Towards realism in modeling ocean wave behavior in marginal ice zones. JGR. https://doi.org/10.1029/97JC01453
Perrie, W., Meylan, M. H., et al. (2022). Modelling wave-ice interactions in three dimensions in the marginal ice zone. Phil. Trans. R. Soc. https://doi.org/10.1098/rsta.2021.0263.
Thomson, J. et al. (2018). Overview of the Arctic Sea state and boundary layer physics program. JGR https://doi.org/10.1002/2018JC013766
Figure 1. Ice floes in the MIZ and ocean waves on 23-24 October. This is a crosswinds event, for the waves entering the sea ice of the MIZ. Simulated waves on Oct 12 at 03:00 UTC. Winds and waves are mostly collinear in open water, becoming crosswind over the MIZ region. Several buoy deployments are shown by colored boxes. Waves are simulated by WW3 using a modern 3D formulation for wave-ice interactions. Peak wave directions are indicted by the arrows. The length of the arrows give the maximum peak wave period (minutes), Pmax, which indicates the scale.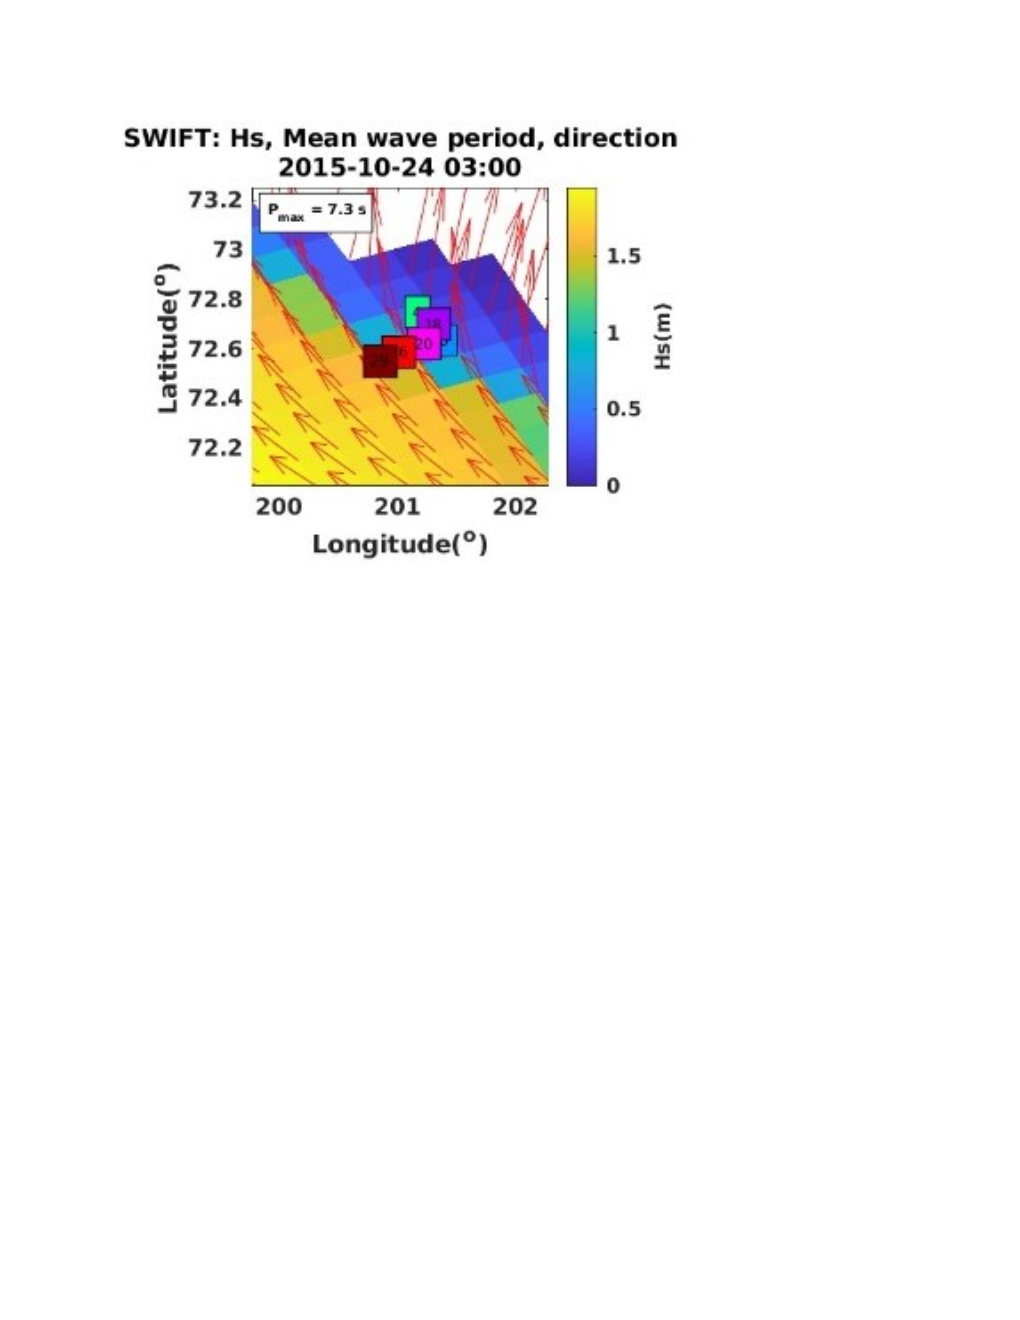
 - Indicates paper has been withdrawn from meeting
 - Indicates an Award Winner