
DESI stands as one of the latest operations-to-research-to-operations prototypes in the National Weather Service, which became available to all offices across the agency in December of 2023. This web- and cloud-based solution adeptly ingests vast amounts of ensemble-based data and presents insightful statistics and visualizations to the end user. These encompass a spectrum of metrics including basic percentiles, percentile ranges, timing uncertainty, and probabilities. A forecaster can display this information in a variety of different perspectives, including plan view, point view, and soundings.
While DESI has become a seasoned application in the realm of data interrogation, the final link in the chain is communication. Guided in part by social science research, DESI has begun to expand its graphics generation features to help share ensemble-based data in a clean and digestible way. This comes in the form of location-based bar charts, line charts and tables, plan view images displaying uncertainty, or videos that capture the evolution of a weather event.
Our presentation aims to showcase the real-world application of DESI, from the numerous ways data can be displayed, to the graphics that can be extracted and communicated. We will further examine current and future work, including how we plan to integrate a comprehensive social science strategy for sustained development.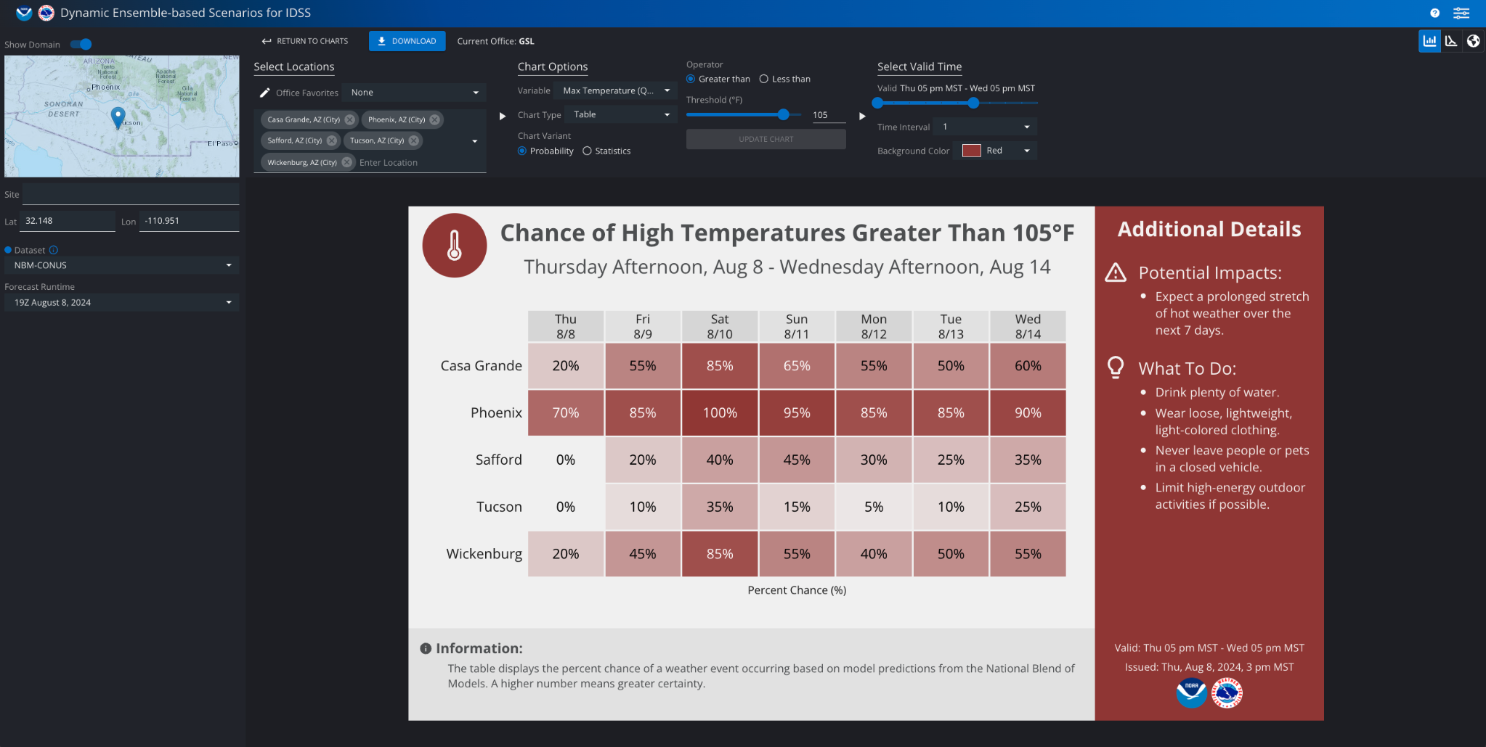
 - Indicates paper has been withdrawn from meeting
 - Indicates an Award Winner