
Thursday, 16 January 2025: 9:45 AM
217 (New Orleans Ernest N. Morial Convention Center)
Offshore wind energy is poised to play a crucial role in the US transition to clean energy. The US government aims to install 30 GW offshore wind farms by 2030. Offshore wind is gaining popularity as an energy source due to its decreasing levelized cost, despite higher material expenses, thanks to its abundance in US coastal regions and proximity to large population centers. Wind speeds offshore are consistently faster than onshore due to lower surface roughness over water. Stable stratification and low ambient turbulence are also more common in offshore environments. However, the efficiency of wind turbines heavily relies on our ability to accurately assess and characterize wind resources in the rotor-swept area.
A low-level jet (LLJ) is one of the most common non-logarithmic wind profiles, generally characterized by a wind speed maxima (core/nose) in the planetary boundary layer (PBL). LLJs can form due to mechanisms ranging from local effects with weak synoptic forces to strong meso-to-synoptic pressure gradients. Regardless of their formation, LLJs are critically important in wind resource assessment. LLJs can enhance wind energy output, but they also increase stress on turbine structures due to increased and varying wind shear and veer in the rotor-swept area. Therefore, optimizing numerical simulations of LLJs is essential for better predicting wind resources. In this study, we conduct ensemble simulations of an LLJ event that occurred on May 15, 2020, off the coast of New York. The ensemble includes all possible combinations using 6 PBL schemes, 2 initial and boundary condition datasets, scenarios with and without dynamic SST input, and 3 modes of Four-Dimensional Data Assimilation (FDDA). Our ensemble study of LLJs differs from previous efforts by incorporating a novel three-dimensional PBL scheme (3DPBL), which better accounts for the influences of spatial inhomogeneities in sea surface temperature (SST) on parameterized turbulence mixing. We hypothesize that the study will likely show no single best option among the tested combinations, highlighting the importance of ensemble runs.
The study employs a grid cell spacing (dx) of 2 km on the inner domain nested within a dx = 6 km outer domain. Utilizing 54 vertical levels with a 10 m vertical grid cell spacing in the lowest 200 m of the atmosphere, the investigation compares the performance of various PBL schemes including MYNN, MYJ, YSU, BouLac, QNSE, and 3DPBL. Initial and boundary conditions are derived from ERA5 and NARR datasets, while SST data is sourced from OSTIA. The study also evaluates different FDDA options: no FDDA, grid analysis nudging, and spectral analysis nudging. The simulation timespan is 14 May 00 UTC to 16 May 01 UTC, 2020, while the analysis timespan is 15 May 14 UTC to 15 May 23 UTC.
This ensemble of simulation is validated using the observational dataset from two floating lidars, E05 (39.97 N, 72.72 W) and E06 (39.55 N, 73.43 W) deployed by the New York State Energy Research and Development Authority (NYSERDA). These floating lidars are mounted on buoys and provide meteorological and oceanic data including wind speed, wind direction, and turbulence intensity every 10 minutes.
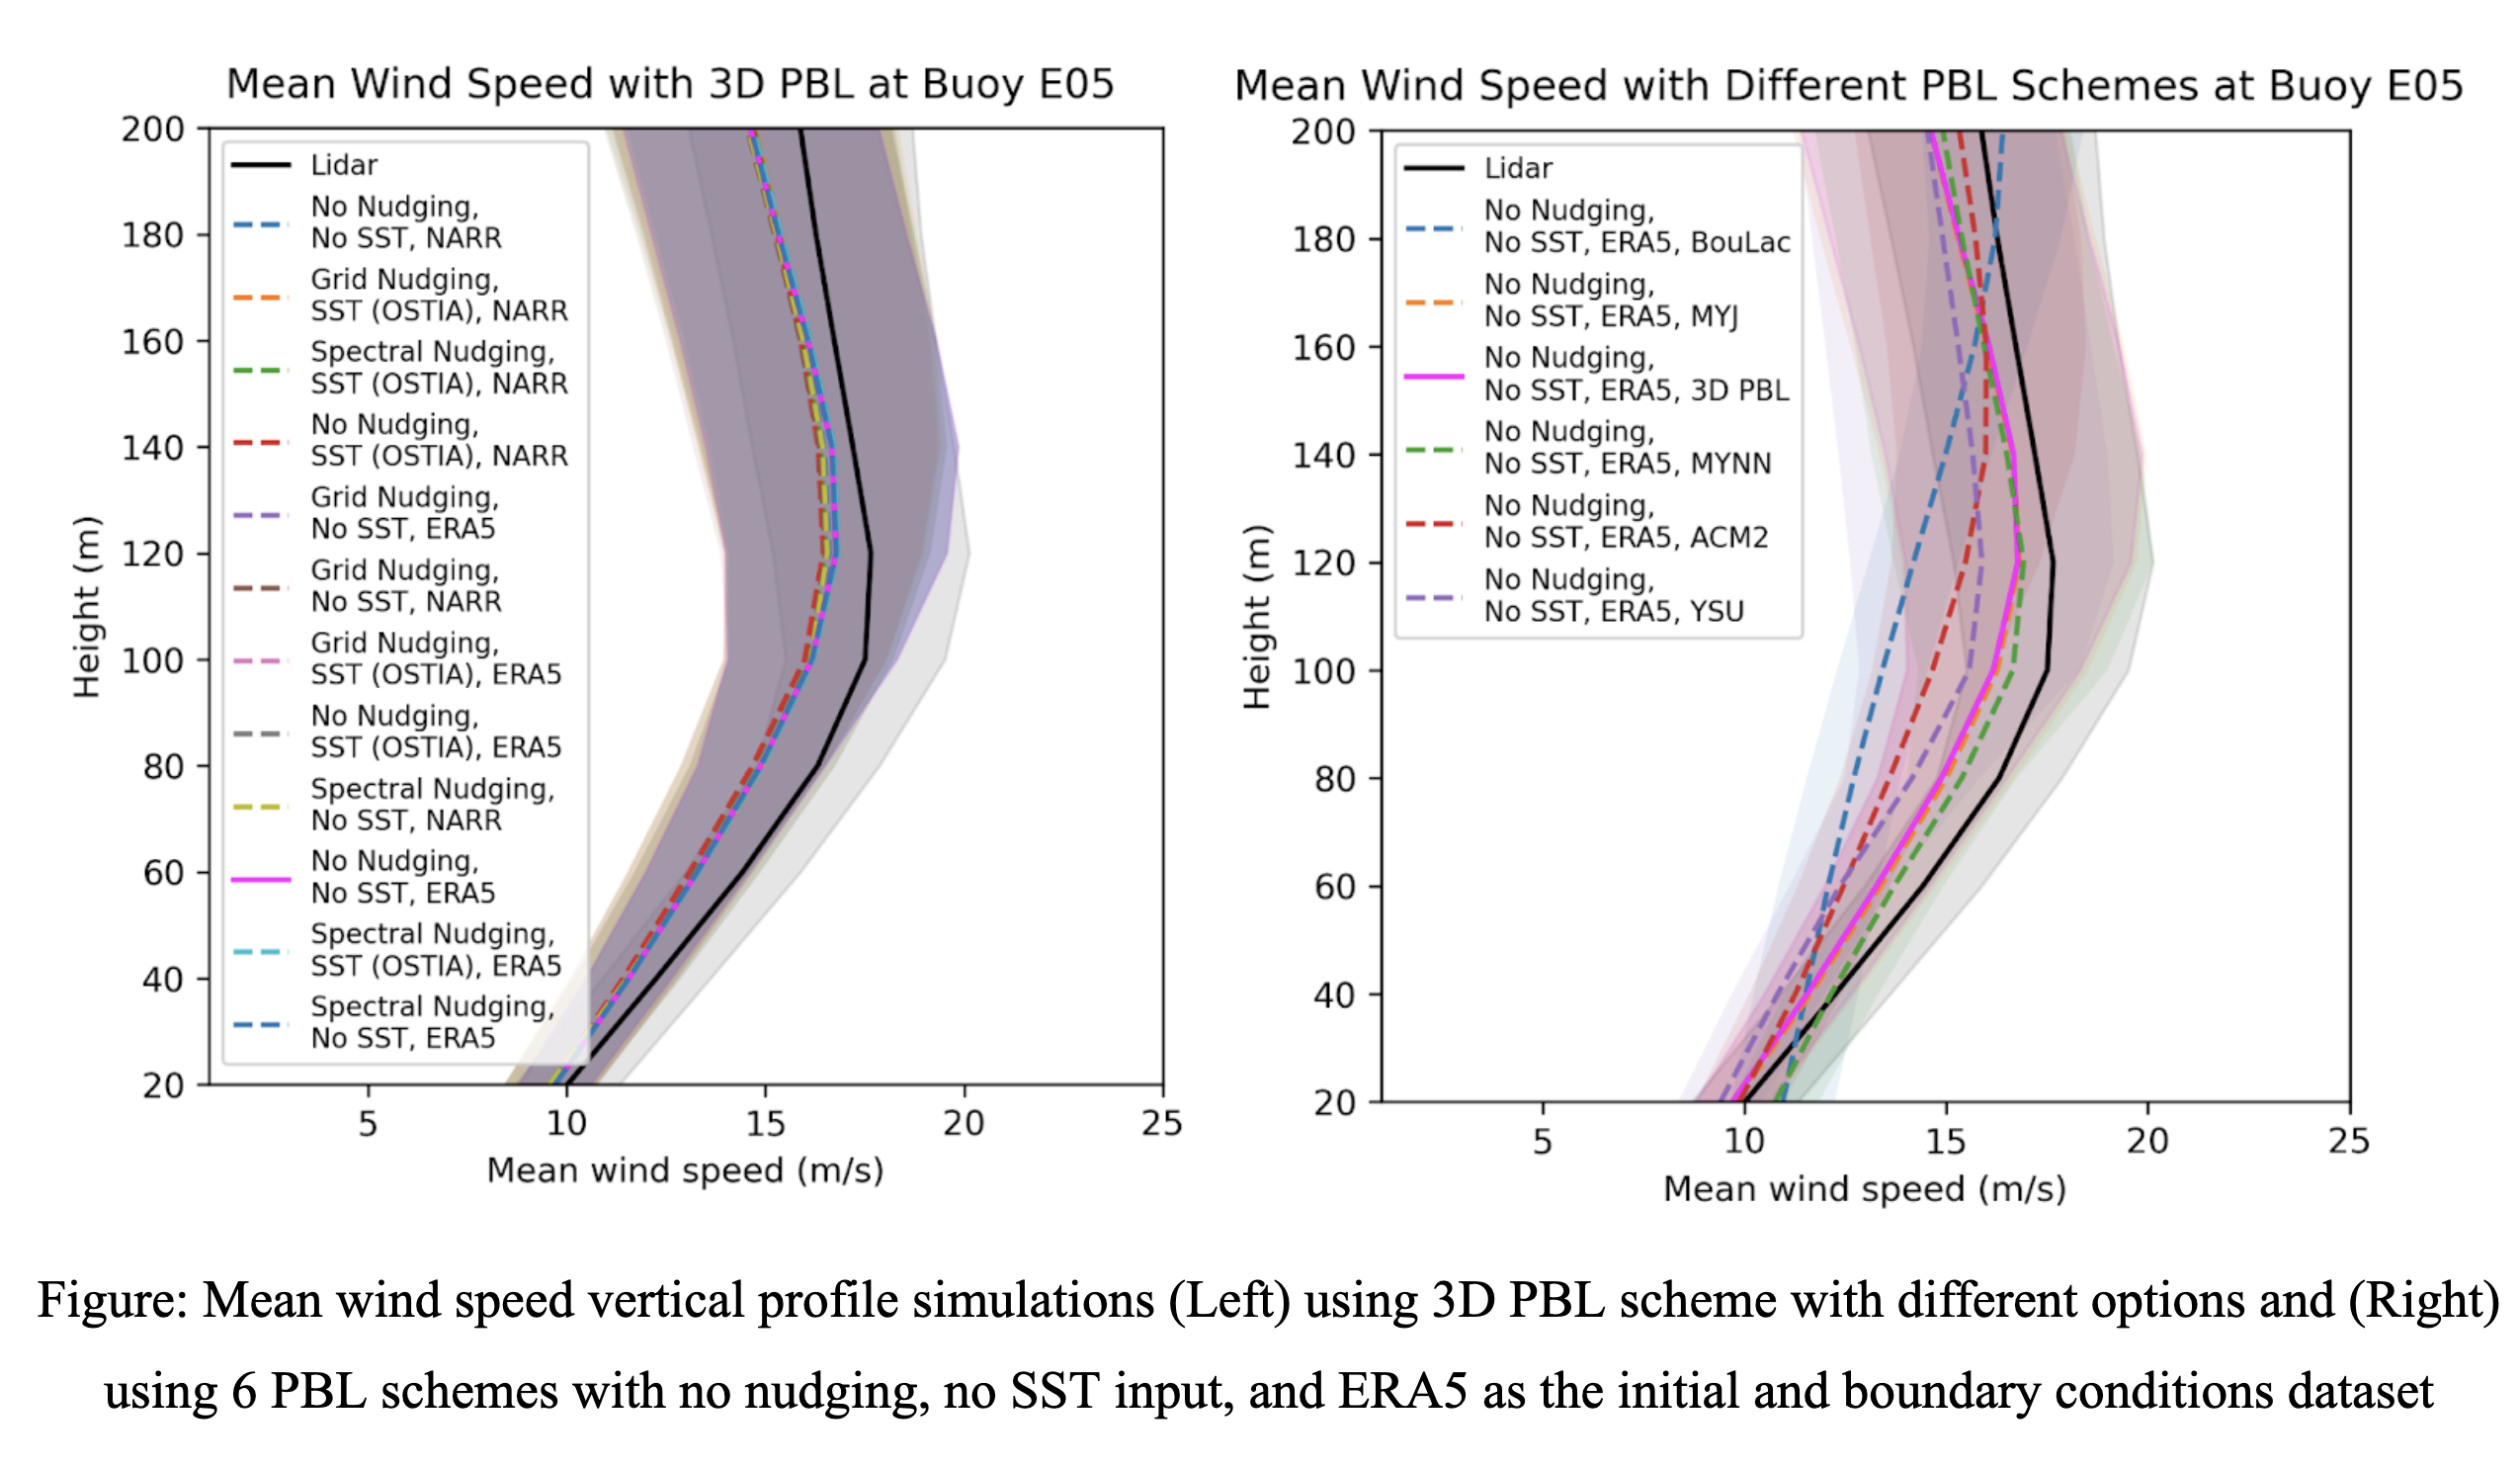
The mean wind profiles for 14-23 UTC of 15 May 2020 show that most simulations capture the LLJ well (see figure), with an underprediction of wind speed. The figure on the left shows all of the simulations with a 3D PBL scheme and they have a little variation of wind speed irrespective of the other options, with negative bias all along. The figure on the right illustrates that the mean wind speed has a significant amount of variation depending on the choice of the PBL scheme. Boulac gives visibly the worst performance among these PBL schemes. Most of the PBL schemes show a negative bias over most of the height but MYNN and Boulac show a positive bias below 40 m.
The presentation will discuss five performance metrics to quantify the errors in the simulations, individually and as an ensemble. These metrics include the bias, the centered root-mean-square error (cRMSE), Pearson’s correlation coefficient, earth mover’s distance (EMD), and standard deviation. We find that there is no clear one “best” simulation to match the lidar observations, but see that the variations in simulations due to the PBL scheme are larger than the variations due to initial/boundary conditions, SST forcing, and grid nudging.
A low-level jet (LLJ) is one of the most common non-logarithmic wind profiles, generally characterized by a wind speed maxima (core/nose) in the planetary boundary layer (PBL). LLJs can form due to mechanisms ranging from local effects with weak synoptic forces to strong meso-to-synoptic pressure gradients. Regardless of their formation, LLJs are critically important in wind resource assessment. LLJs can enhance wind energy output, but they also increase stress on turbine structures due to increased and varying wind shear and veer in the rotor-swept area. Therefore, optimizing numerical simulations of LLJs is essential for better predicting wind resources. In this study, we conduct ensemble simulations of an LLJ event that occurred on May 15, 2020, off the coast of New York. The ensemble includes all possible combinations using 6 PBL schemes, 2 initial and boundary condition datasets, scenarios with and without dynamic SST input, and 3 modes of Four-Dimensional Data Assimilation (FDDA). Our ensemble study of LLJs differs from previous efforts by incorporating a novel three-dimensional PBL scheme (3DPBL), which better accounts for the influences of spatial inhomogeneities in sea surface temperature (SST) on parameterized turbulence mixing. We hypothesize that the study will likely show no single best option among the tested combinations, highlighting the importance of ensemble runs.
The study employs a grid cell spacing (dx) of 2 km on the inner domain nested within a dx = 6 km outer domain. Utilizing 54 vertical levels with a 10 m vertical grid cell spacing in the lowest 200 m of the atmosphere, the investigation compares the performance of various PBL schemes including MYNN, MYJ, YSU, BouLac, QNSE, and 3DPBL. Initial and boundary conditions are derived from ERA5 and NARR datasets, while SST data is sourced from OSTIA. The study also evaluates different FDDA options: no FDDA, grid analysis nudging, and spectral analysis nudging. The simulation timespan is 14 May 00 UTC to 16 May 01 UTC, 2020, while the analysis timespan is 15 May 14 UTC to 15 May 23 UTC.
This ensemble of simulation is validated using the observational dataset from two floating lidars, E05 (39.97 N, 72.72 W) and E06 (39.55 N, 73.43 W) deployed by the New York State Energy Research and Development Authority (NYSERDA). These floating lidars are mounted on buoys and provide meteorological and oceanic data including wind speed, wind direction, and turbulence intensity every 10 minutes.
The mean wind profiles for 14-23 UTC of 15 May 2020 show that most simulations capture the LLJ well (see figure), with an underprediction of wind speed. The figure on the left shows all of the simulations with a 3D PBL scheme and they have a little variation of wind speed irrespective of the other options, with negative bias all along. The figure on the right illustrates that the mean wind speed has a significant amount of variation depending on the choice of the PBL scheme. Boulac gives visibly the worst performance among these PBL schemes. Most of the PBL schemes show a negative bias over most of the height but MYNN and Boulac show a positive bias below 40 m.
The presentation will discuss five performance metrics to quantify the errors in the simulations, individually and as an ensemble. These metrics include the bias, the centered root-mean-square error (cRMSE), Pearson’s correlation coefficient, earth mover’s distance (EMD), and standard deviation. We find that there is no clear one “best” simulation to match the lidar observations, but see that the variations in simulations due to the PBL scheme are larger than the variations due to initial/boundary conditions, SST forcing, and grid nudging.
 - Indicates paper has been withdrawn from meeting
 - Indicates an Award Winner