
The first part of the talk reviews application of JEDI to construction of the gridded sea level product, accompanying error estimates, and surface currents. The primary input data sets are along-track {1 sec} sea level observations from 13 altimeter satellites that are archived in the Radar Altimeter Database System (RADS) along with the consistent corrections for atmospheric transmission, tides, and other geophysical effects, including reprocessed data from the TOPEX mission. Long-wavelength errors are handled by objectively mapping the long and short wavelengths separately (scale-separation). The mapping is carried out using the FGAT form of 3DVar with a simple advective forecast model. Mean dynamic topography is provided by the new 1993-2012 Mean Dynamic Topography MDT-CNES-CLS2022. Tradeoffs associated with improvements associated with a 4DVar are discussed.
The second half of the talk begins with a comparison to the widely used Copernicus Marine Environment Monitoring Service SSALTO/DUACS multi-mission daily global altimeter sea level product and to a reference set of coastal and island tide gauges. The remainder of the talk examines some of the climate implications of sea level variability and change 1993-2023 beginning with global sea level and its changing pattern of rise (Figure 1). Differences in the two sea level estimates in the 1990s may reflect the inclusion of newly reprocessed observations. Sea level rise in the 1990s was most rapid in the western Pacific, consistent with a positive phase of the Pacific Decadal Oscillation. By 2010 the rise is most rapid in the Northern Oceans as a result of the reversal of the phase of the PDO and warming of the northern thermocline.
Figure 1 Global monthly sea level 1993-2023. (black) JEDI-RADS, (blue) CMEMS/DUACS. The 2010-2022 average rise is 4.1 mm/yr. Inset maps show spatial structure of sea level rise during (left) 1993-2002 and (right) 2010-2022. Shades show anomalies separated by 1 mm/yr increments.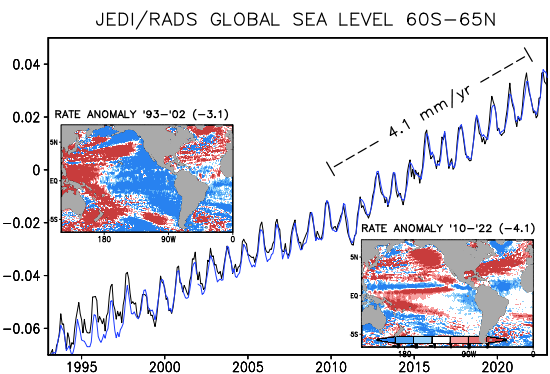
 - Indicates paper has been withdrawn from meeting
 - Indicates an Award Winner