
Monday, 13 January 2025: 11:45 AM
226 (New Orleans Ernest N. Morial Convention Center)
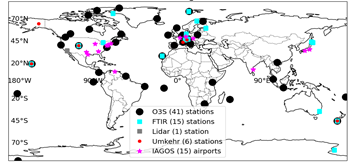
Ground-based (GB) observations of upper troposphere/lower stratosphere (UT/LS) ozone are increasingly used to evaluate model performance and satellite products in these altitude ranges but GB data themselves can display biases and discontinuities over time. The TOAR-II (Tropospheric Ozone Assessment Report) Working Group, HEGIFTOM (Harmonization and Evaluation of Ground-based Instruments for Free-Tropospheric Ozone Measurements; https://hegiftom.meteo.be/datasets) has used “homogenized” datasets to determine trends (2000-2022) in a nominal total tropospheric column (“TrOC” to 300 hPa), in the free troposphere (FT, 300<p<700 hPa) and in the lower troposphere (p> 700 hPa) from 5 network instrument types: ozonesondes, IAGOS profiles, FTIR, Lidar and Dobson Umkehr. Quantile Regression (QR) and Multiple Linear Regression (MLR) methods were employed. Key findings are: (1) For both statistical methods, pole-to-pole and across the full longitude range of observations, medians TrOC trends at all sites fall within +3 ppbv/decade to -3 ppbv/decade. (2) There are comparable numbers of negative and positive TrOC trends, i.e., “zonal” mean tropospheric trends do not apply. (3) For the stations in (1), FT ozone columns fall within +2 ppbv/decade to -2 ppbv/decade. These changes are equivalent to +(1-2)%/decade except over SE Asia where increases are typically 5-7%/decade (Stauffer et al., https://acp.copernicus.org/articles/24/5221/2024). (4) Lower stratosphere (LS) ozone trends, from tropopause to 50 hPa, are slightly negative (-[2-4]%/decade). The complexity of regional and seasonal variations in ozone changes is captured with monthly-average trends derived from MLR. In some cases, i.e. within relatively densely sampled Europe and North America, “nearby” sites often exhibit diverging patterns that are assumed to derive from variable sources or localized dynamical influences. At several sites where multiple techniques are deployed, trend seasonality differs from one instrument to another. In general, however, the comprehensive HEGIFTOM analyses show that multi-instrument, harmonized data provide robust annual and seasonally averaged trends (2000-2022) for a reference by which satellite products and model output can be confidently evaluated.
 - Indicates paper has been withdrawn from meeting
 - Indicates an Award Winner