
This work uses real WRF simulations to investigate the sensitivity of the PBL scheme selection on wind farm wakes by comparing the 1D Mellor-Yamada-Nakanishi-Niino (MYNN) PBL scheme and a three-dimensional (3DPBL) scheme (with the PBL approximation) against two sets of in-situ observations. The two in-situ datasets include FINO1 tower observations and Wind Park Far Field (WIPAFF) aircraft observations taken above a wind farm. Additional WRF modeling parameters are also evaluated, including TKE advection (on vs. off), the wind farm option [Fitch vs. no wind farm (NWF)], output field (wind speed and TKE), and wind farm TKE factor (0, 0.25, 1). Model results are evaluated according to four error metrics: the bias, centered root mean square error (cRMSE), earth mover’s distance (EMD), and Pearson correlation coefficient R2.
The optimal PBL scheme depends on modeling option and error metric. For example, 3DPBL Fitch outperforms MYNN Fitch for three out of four metrics at the FINO1 site when predicting wind speed. For TKE, however, MYNN Fitch outperforms 3DPBL Fitch for three out of four metrics based on the aircraft observations. The optimal wind farm TKE factor reveals a similar dependence. The aircraft domain consistently supports a wind farm TKE factor between 0 and 0.25 for 3DPBL cases and a wind farm TKE factor of 1 for MYNN cases. The FINO1 site shows mixed results based on the error metric. Both the bias and EMD suggest maximal external TKE injection while the other metrics support no external TKE injection. Implementing advection is shown to be important to avoid unphysical turbulence build ups near the turbines.
Figure 1. 100-m wind characterization for the inner region for both no-wind-farm (a, c, and e) and wind-farm (b, d, and f). The black dots shown in panels b), d), and f) represent wind turbines. The normalized wind speed deficit is given by: λ = (UFitch - UNWF)/UNWF x100% where UNWF represents the wind speed in a no-wind-farm simulation and UFitch represents the wind speed in the analogous simulation with wind turbines. a) Wind speed for a no-wind-farm simulation with 3DPBL scheme. c) Wind speed for a no-wind-farm simulation but with the MYNN scheme. e) Difference (3DPBL - MYNN) in wind speed. b) Normalized wind speed deficit for 3DPBL simulation. d) Normalized wind speed deficit for MYNN simulation. f) Difference (3DPBL-MYNN) in normalized wind speed deficit.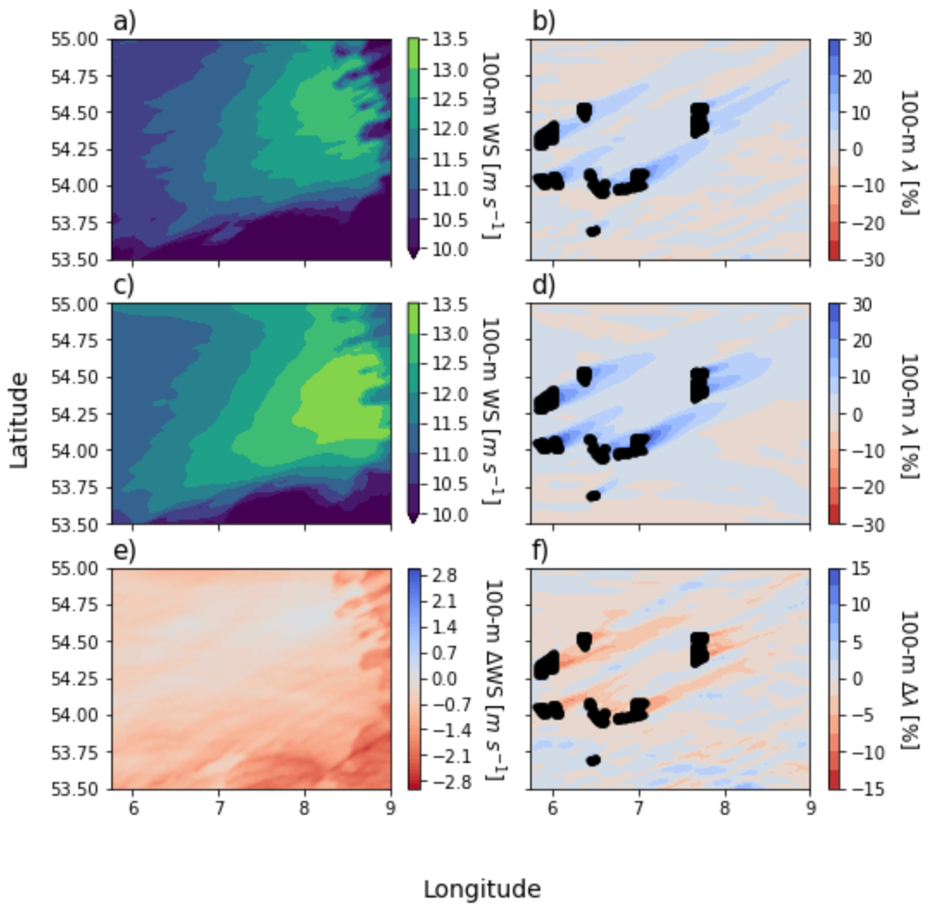
 - Indicates paper has been withdrawn from meeting
 - Indicates an Award Winner