
To assess this relationship offshore, we carry out a suite of simulations using the Weather Research and Forecasting model for the Massachusetts-Rhode Island wind resource area during stably stratified conditions with a range of PBLHs based on case studies from the WFIP3 field experiment. We vary the PBL scheme between the “standard” MYNN PBL scheme and the three-dimensional PBL (3DPBL) scheme, and vary options for the wind farm parameterization (amount of added turbulence), resulting in eight simulations for each case study. The two no-wind-farm simulations are validated by comparison to profiling lidar observations on Block Island and Martha’s Vineyard. Using a machine learning model, we assess the magnitude of the wind farm wake area and length from the simulations. When we compare that area (Figure a), length (Figure b), and resulting power deficit as a function of the PBLH upwind of the simulated wind farm, we find that deeper PBLHs result in smaller, shorter, and less consequential wakes (Figure a,b). These results, which suggest that wake impacts are predictable, can aid grid operators in anticipating times of significant wake impacts when other electrical supply sources or battery resources may be required.
Figure: The mean (a) wake area and (b) length as a function of the mean lease area PBLH during stable conditions, where the PBLH values are binned every 50 m from 125 m to 575 m. The mean PBLH values are calculated as the average PBLH across the wind lease area. For each bin, the blue dots show the mean value, and the blue vertical lines represent the ±1 standard deviation error bar. The best-fit line for the bin means is in red. Each panel displays the line of best fit equation, R2 value, and p-value on the top.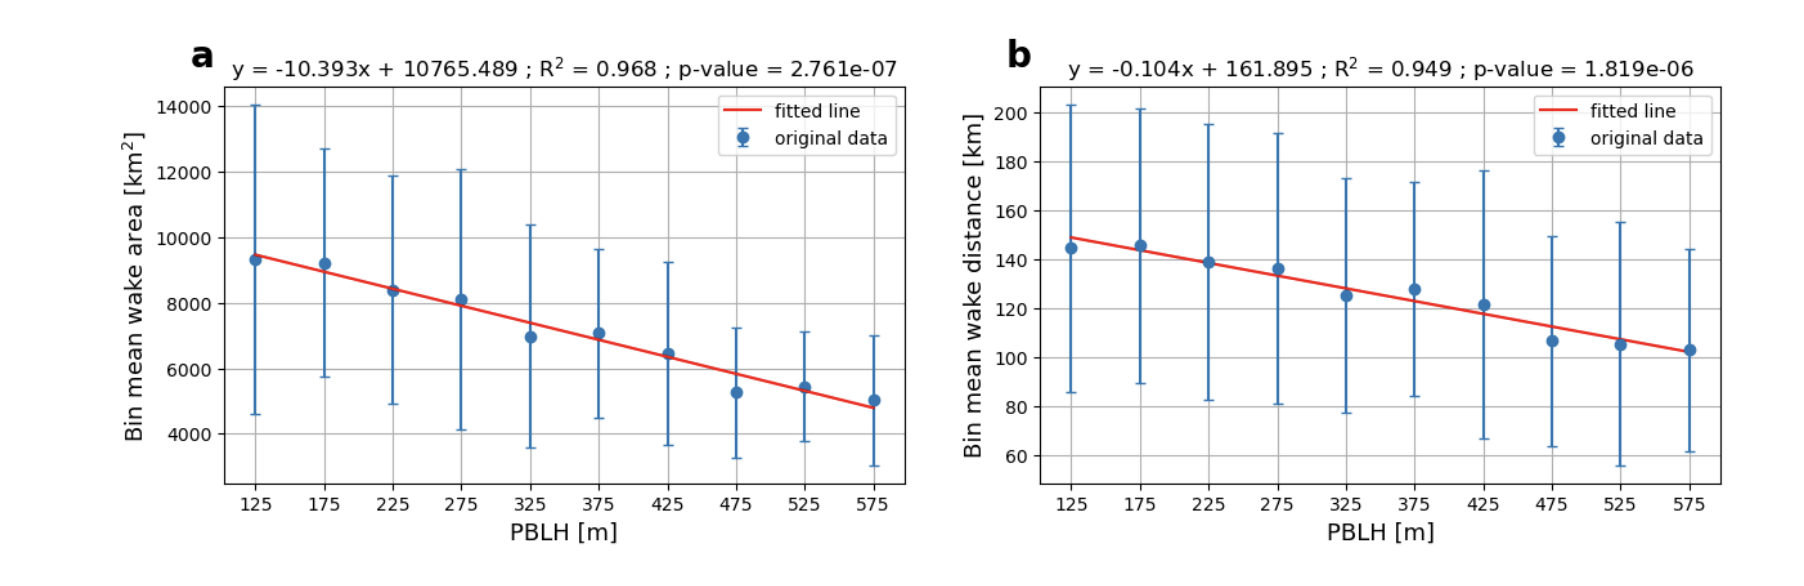
 - Indicates paper has been withdrawn from meeting
 - Indicates an Award Winner