
We assess the variability of these stability metrics based on one year of simulations in the NOW-WAKES simulated dataset using the Weather Research and Forecasting (WRF) model, using the “no wind farm” simulations. The first comparison considers surface Obukhov Length as calculated from surface fluxes output directly from WRF (Figure a) and compares that to the WRF output surface stability variable RMOL (inverse Obukhov Length), showing that even surface-based modeling methods can disagree more than 5% of the time. Further, evaluation of simulated averaged potential temperature profiles by month (Figure b) suggest that months with a predominance of surface-based unstable conditions like September and October demonstrate averaged potential temperature profiles that indicate stable stratification. The presentation will summarize a set of comparison of stability metrics and will make recommendations for future stability evaluations. Further, we will quantify how frequently decoupling occurs in simulations of the Massachusetts-Rhode Island wind resource areas such that surface-based stability metrics are misleading for understanding wind turbine rotor layer dynamics.
Figure Caption. a) Comparison of L−1 calculated from WRF output UST and HFX (x-axis) and the WRF output variable RMOL (y-axis) at the center of one of the Massachusetts-Rhode Island wind lease areas. The percentage of points that fall into each quadrant (divided by the dashed gray lines) are represented by the text in each quadrant b) Monthly averaged WRF-simulated potential temperature profiles at the same location. Horizontal gray lines indicate the levels of the hub height (dashed) and the rotor-swept area (solid). While September and October appear predominantly unstable based on surface estimates, potential temperature gradients within the rotor-swept area suggest slightly stable conditions, supporting inferences that offshore conditions are stable during late summer.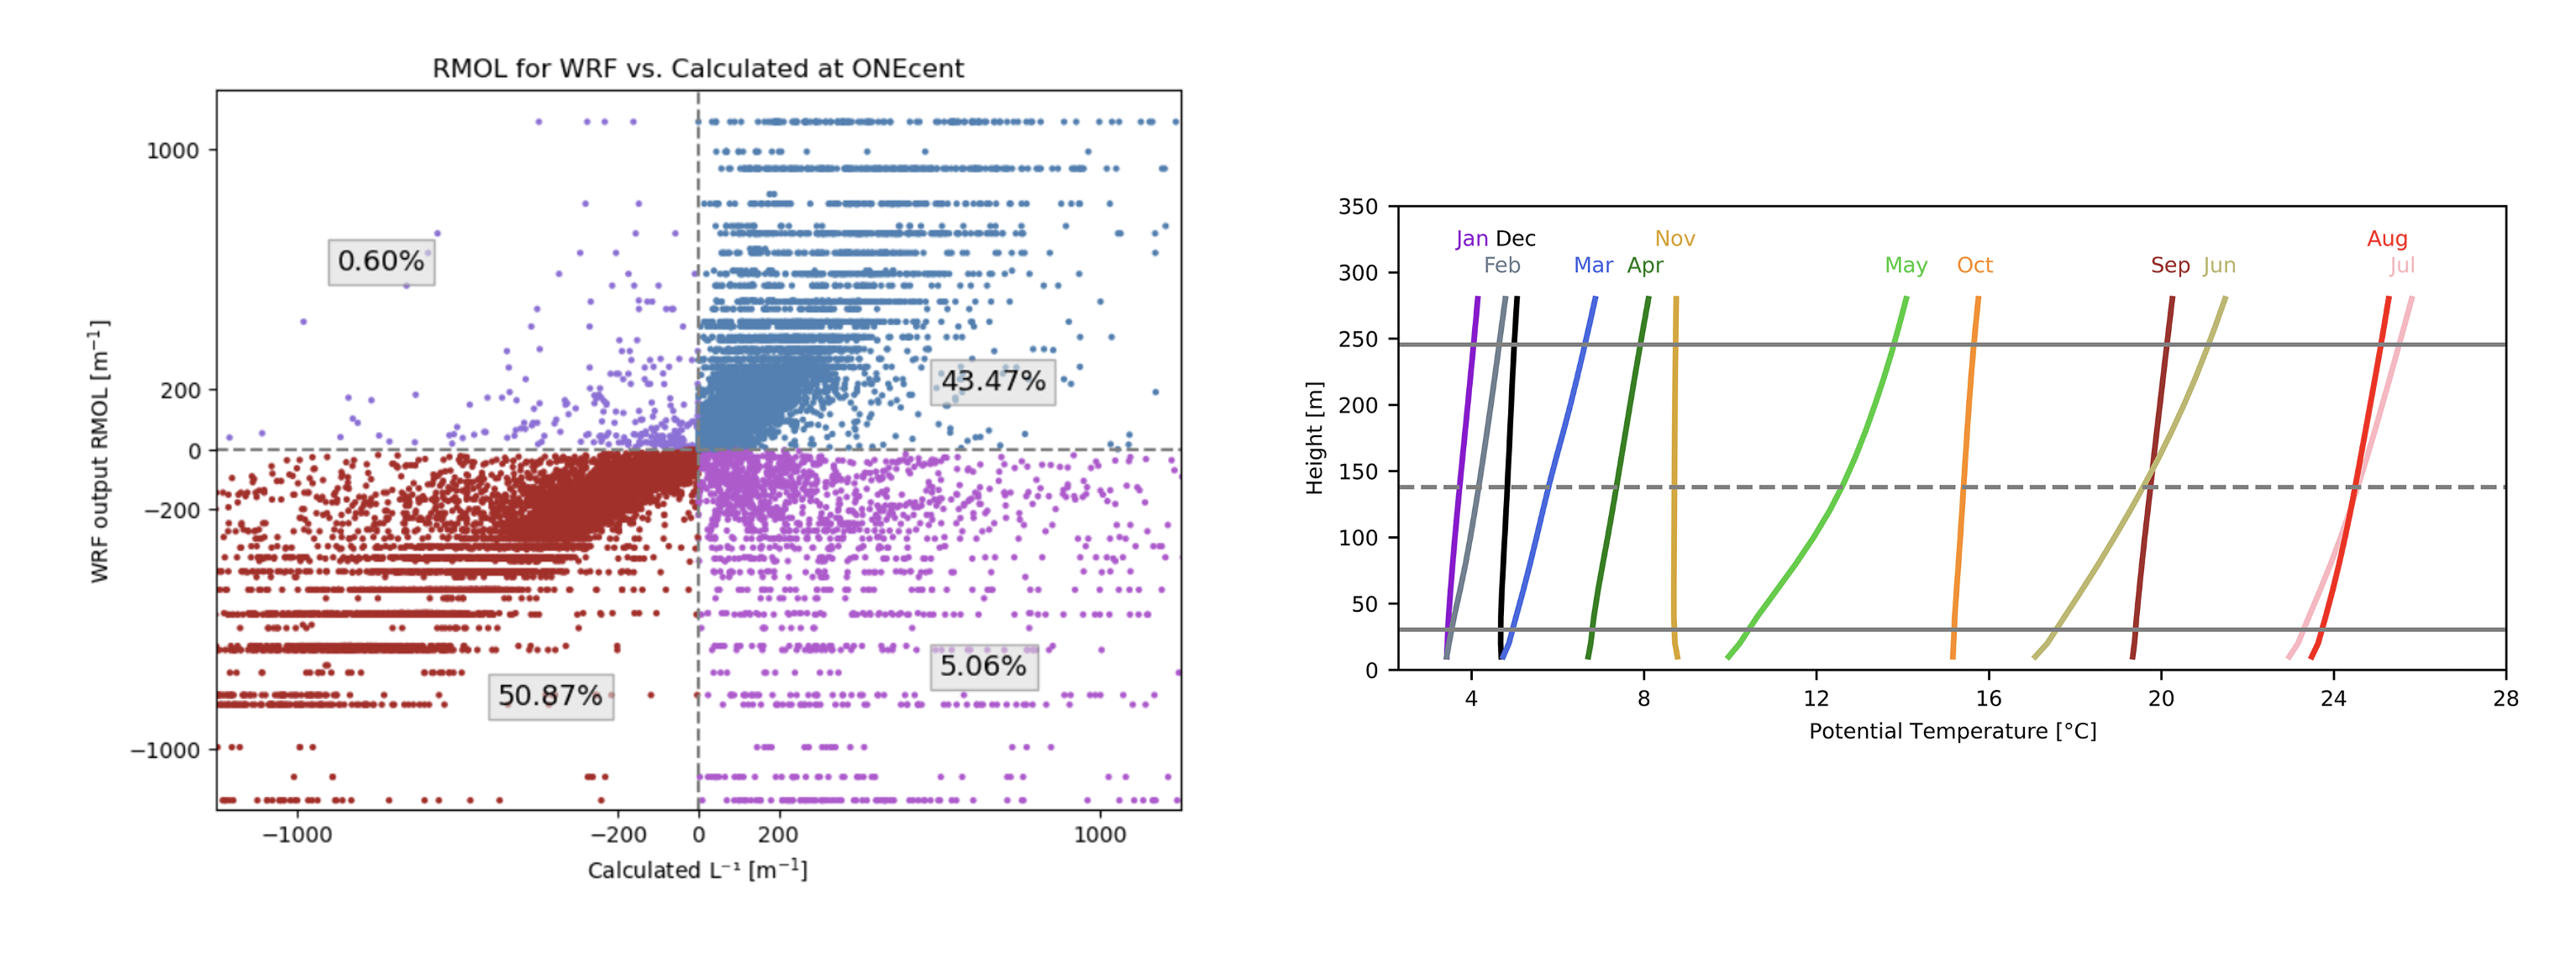
 - Indicates paper has been withdrawn from meeting
 - Indicates an Award Winner