
On December 30, 2021—far outside the traditional Front Range fire season—the Marshall Fire burned for a little over a day, fanned by hurricane-force winds and fueled by grasses that had benefitted from a wet spring and then died in a dry summer and fall. Within an hour of ignition just south of Boulder, CO, the fire had swept across three miles of intervening grassland and reached the town of Superior, where it became an urban conflagration, crossed a major highway and entered the town of Louisville. By the time the fire was extinguished (by six inches of snow falling in the following day), 1084 homes, seven commercial properties, and two lives had been lost. With economic losses estimated at $2 billion, it was the most expensive fire in Colorado history and, at the time, the tenth most expensive fire in US history.
Clear in this event is the role played by the preceding hydroclimate: a wet spring followed by a dry summer, fall, and early winter. At the heart of this drought-wildfire nexus is the role of the demand side of the land-atmosphere moisture balance, or evaporative demand (E0). E0 may be understood as the “thirst of the atmosphere” (it is commonly, though imprecisely, known as “PET”), but it has until recently been ignored or treated poorly, due to lack of driving data and of poor parameterization and scientific understanding.
At NOAA-Physical Sciences Laboratory we have developed a long-term reanalysis of a physically based measure of E0, from the Penman-Monteith reference evapotranspiration (the gold standard) and driven by the North American Land Data Assimilation System phase 2 (NLDAS-2) reanalysis. We use this E0 reanalysis to drive the Evaporative Demand Drought Index (EDDI), which we also developed at NOAA-PSL. Although primarily a drought-monitoring index, EDDI has become an important tool for assessing surface moisture conditions by those in the wildfire monitoring community.
Further, we have developed a technique to decompose the anomalies in E0 into the relative impacts of its meteorological drivers—air temperature, humidity, wind speed, and solar radiation—which we can quantify across time and space. This decomposition is rigorous, physically based, accurate, and is available in near-real time at all timescales relevant to wildfire fuels development and incident weather.
Here I will summarize the role of E0 at the heart of the drought-wildfire nexus and the development of EDDI and its application to wildfire prediction and monitoring. It will concentrate on the specific application of the decomposition technique to the Marshall Fire, where it uncovers the hydroclimatic signature of the entire fire and its lead-up: the growth of live fuels in the wet spring, the development of dead fuels in the dry summer and fall, and then the wildfire event itself. In the attached graphic, the multi-scalar signals of the cool, wet spring (increasingly negative E0 anomaly) followed by the dry summer, fall, and early winter (coming out of this E0 deficit) are clear. The technique has as-yet unexplored applications in ongoing monitoring of fuel and wildfire conditions, and in forecasting of fuel loads and fire weather.
FIGURE CAPTION: E0 signal of the moisture conditions leading up to and immediately after the 2021 Marshall Fire, Boulder Co., CO. Accumulation of E0 anomaly from March 1 through ignition (December 30) for the point of ignition, and the contributions from each of the drivers of E0 (air temperature T, solar radiation Rd, humidity q, and wind speed U2).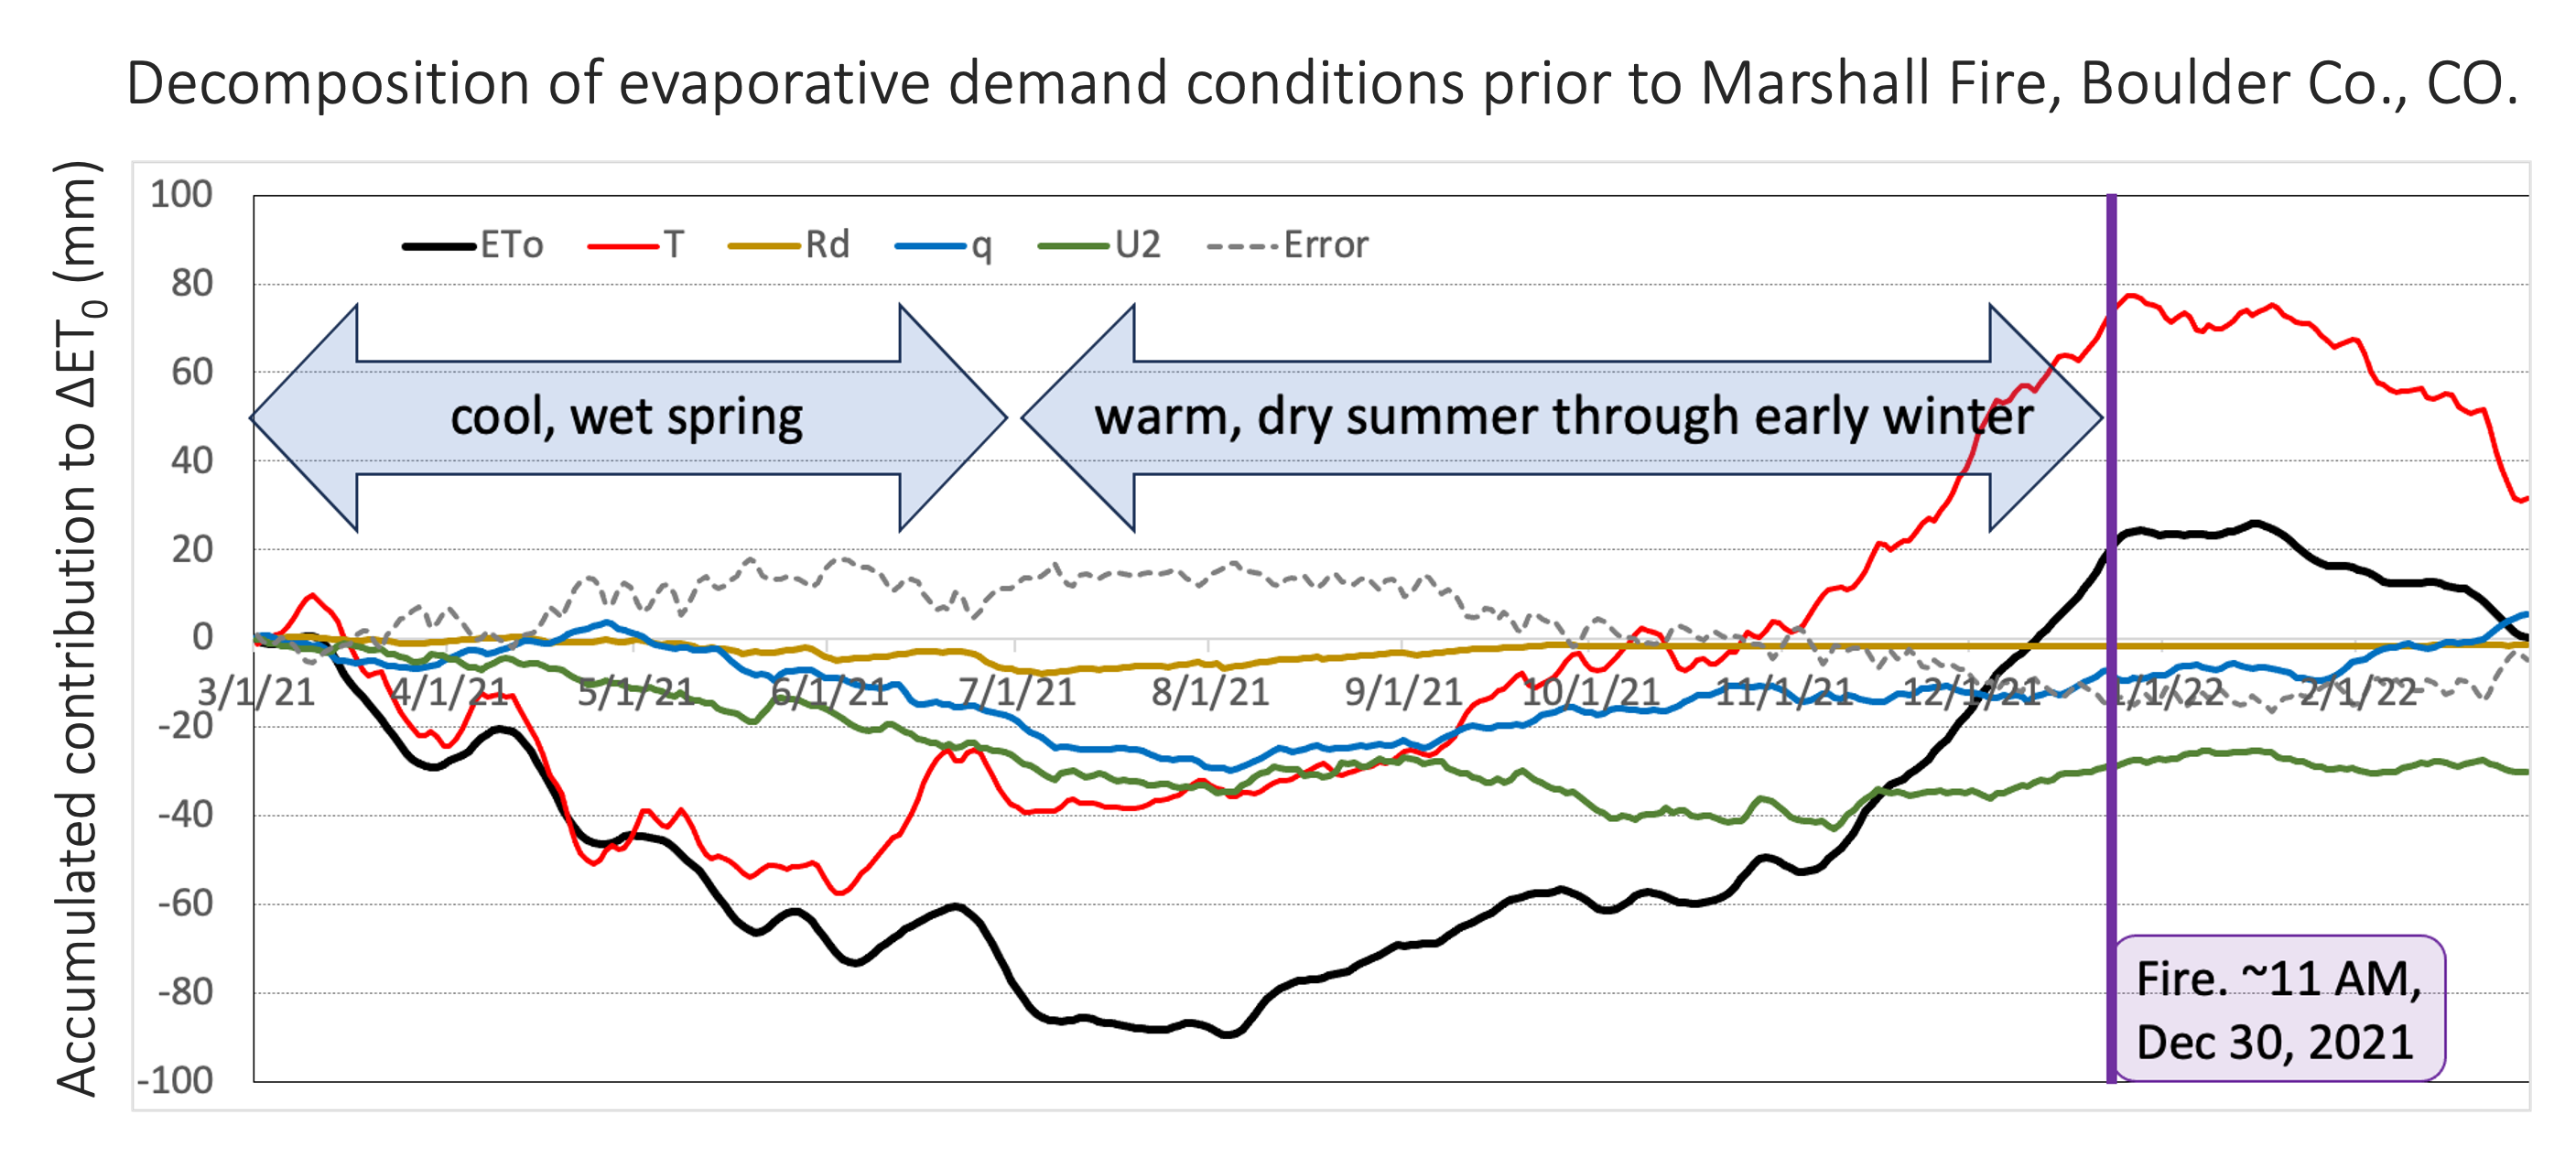
 - Indicates paper has been withdrawn from meeting
 - Indicates an Award Winner