
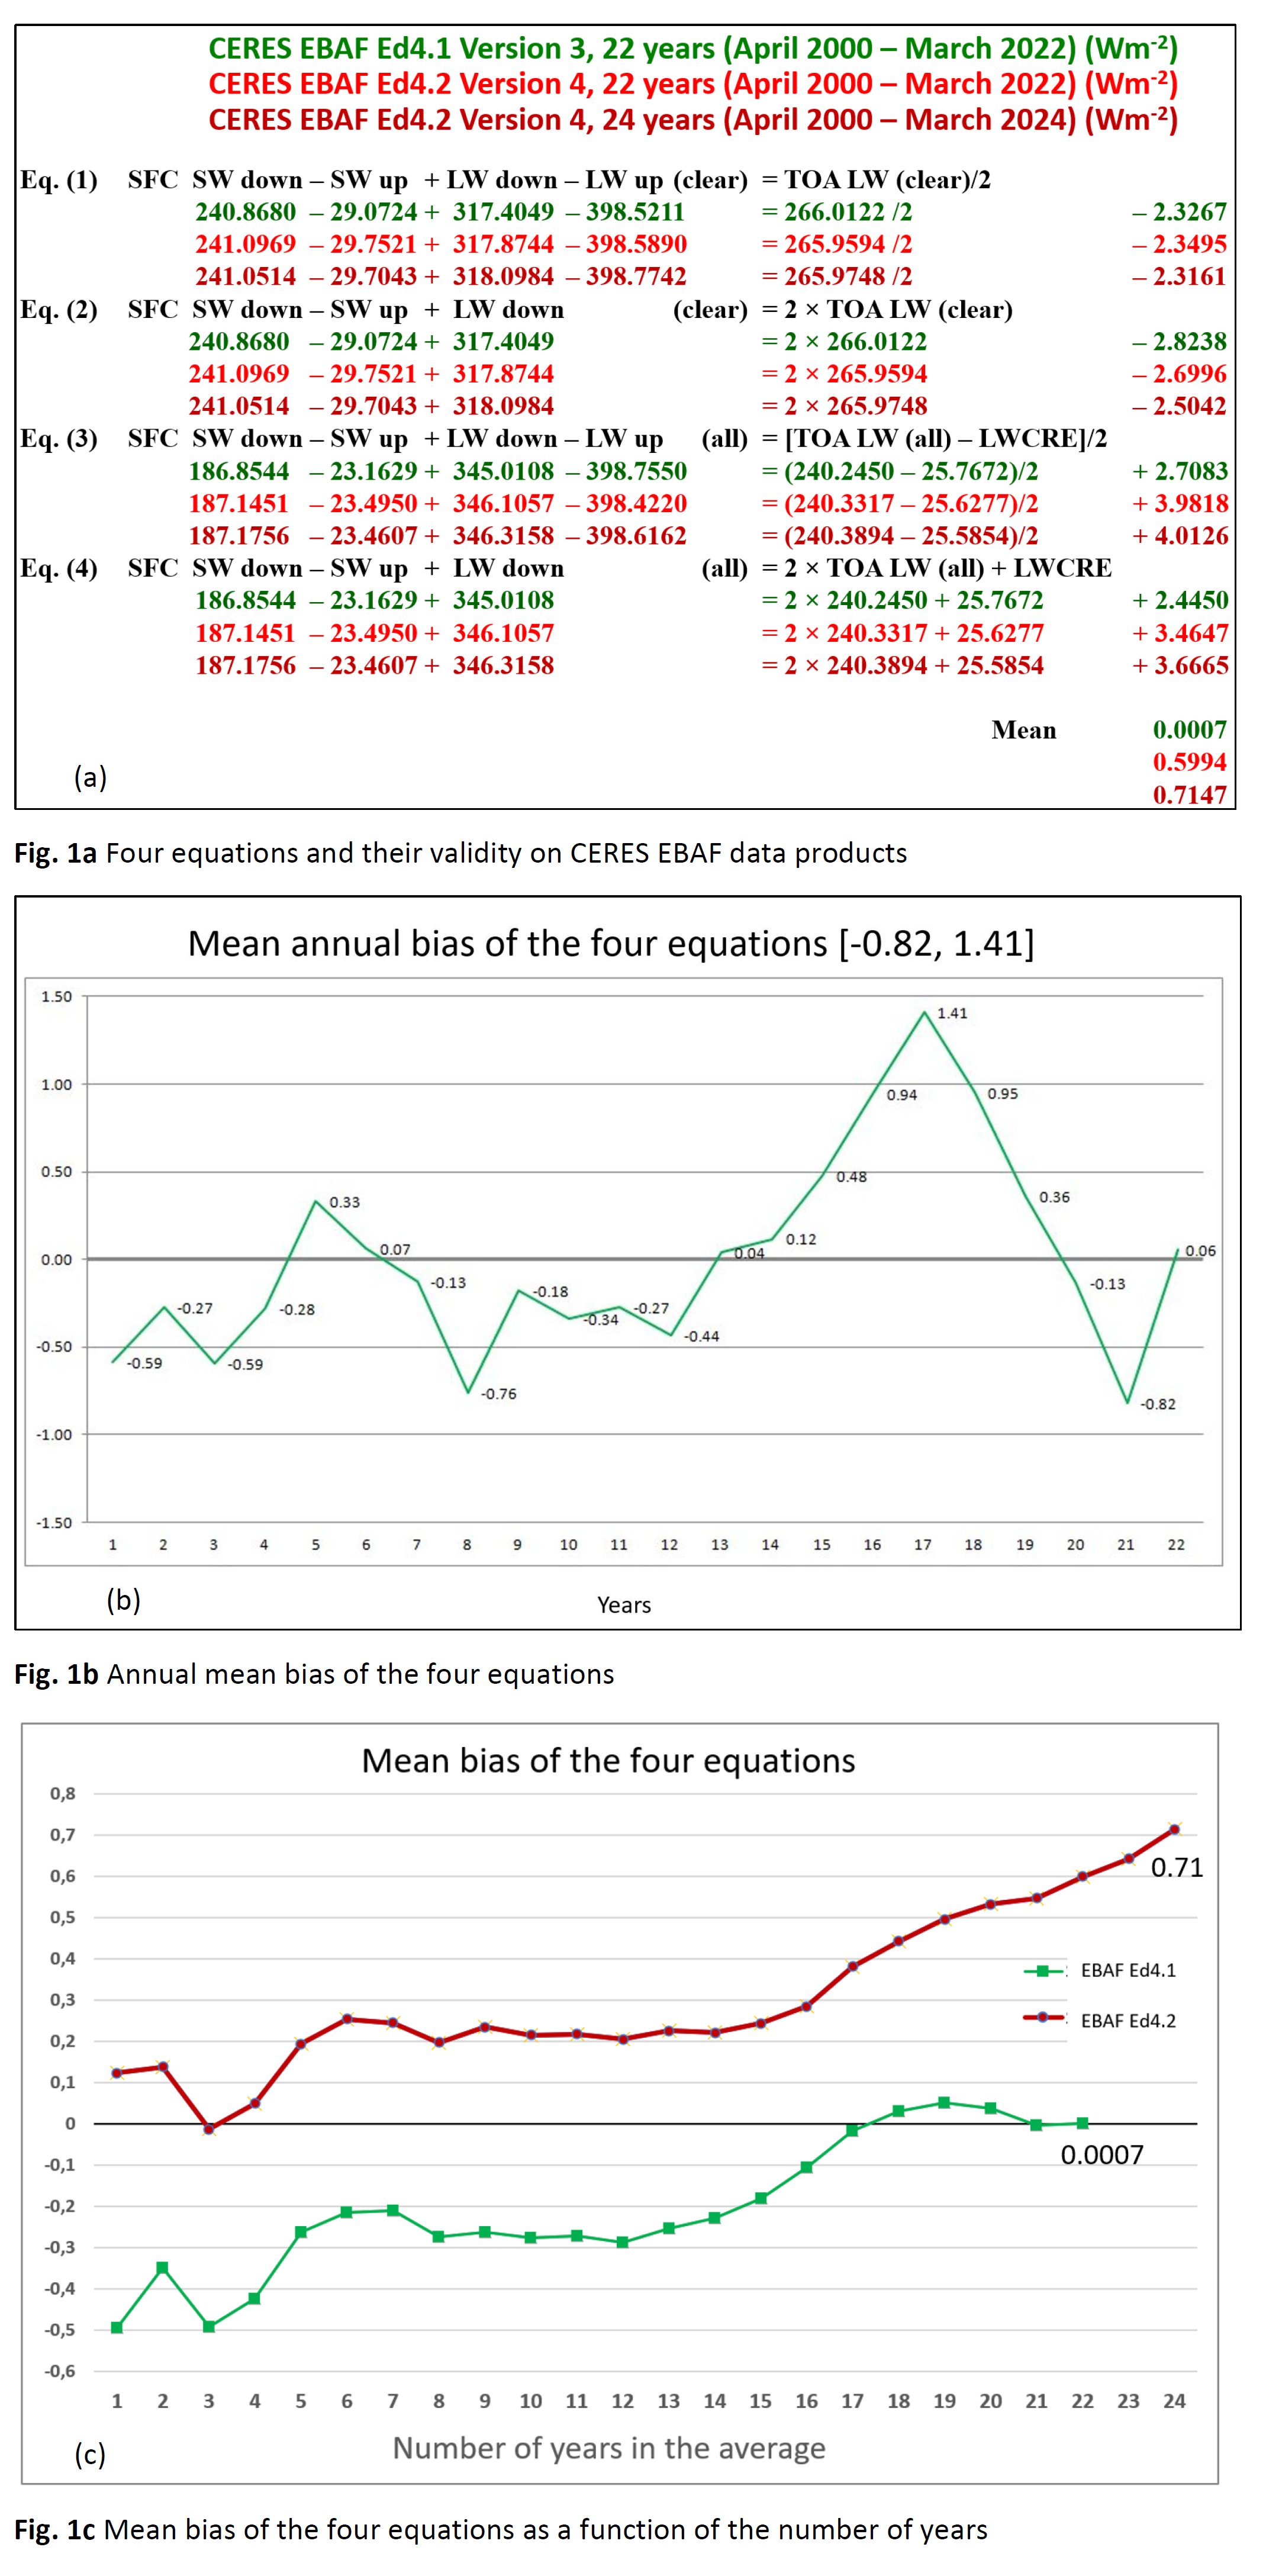
The first equation describes RN (clear-sky) = SFC (SW net + LW net) (clear-sky) = (SW down – SW up) + (LW down – LW up) (clear-sky), being equal OLR(clear-sky)/2.
The second equation gives the total SW + LW absorbed radiation (RT) at the surface (SW down – SW up + LW down), as RT = 2OLR in the clear-sky.
The third and fourth equations are created from the first pair, by separating atmospheric radiation transfer from the longwave effect of clouds (LWCRE) and using all-sky data on both sides: Surface SW net + LW net (all-sky) =[OLR(all-sky) – LWCRE]/2; and Surface (SW + LW) absorbed (all-sky) = (SW down – SW up + LW down) (all-sky) = 2OLR(all-sky) + LWCRE.
The biases of the individual equations are within the range of ± 2.83 Wm-2; the mean bias of the four equations is 0.0007 Wm-2 (this justifies the use of four decimal places in the netCDF file).
This unprecedented accuracy of the constraint equations raises a couple of questions. Do these four equations express an arithmetic identity? The answer is no; in the prevailing theory we are not aware of any relationship that would require these couplings between surface and TOA irradiances, without referring to any atmospheric gaseous composition or the optical depth. Further, there are notable differences between the annual values: the mean bias of the four equations fluctuates between -0.8 and 1.4 [Wm-2] during the years (Fig. 1b). Or, are these four equations built in the CERES data production protocol? No again: the mean bias in the first five years vary between -0.5 and -0.2 [Wm-2] and it approaches zero after including 17 years into the averaging; then it occupies the value of zero and remains there after only two decades (Fig. 1c).
As Terra and Aqua spacecrafts have begun orbital maneuvers in 2021 since their orbits started drifting, a new, adjusted dataset, CERES-EBAF Edition 4.2 was introduced. We use Version 4 data, first on the same period (April 2000-March 2022); the differences become as follows: -2.35, -2.70, 3.98, 3.46; the mean bias is 0.60 [Wm-2]. Then we used the extended period April2000-March2024, and have -2.32, -2.50, 4.01, 3.67, with a mean of 0.715 [Wm-2]. As it can be seen, the transition between the platforms led to an increase of the mean bias by about 0.6 Wm-2 during the same time period, increasing further over 0.7 Wm-2 for the last two years of observations.
Notice that the clear-sky equations prescribe the ratio
RN : (TOA_LW_up) : (SFC_LW_up) : RT = 1 : 2 : 3 : 4 ,
resulting in a clear-sky greenhouse factor of
g(clear-sky) = G(clear-sky)/(SFC_LW_up) = [(SFC_LW_up) – (TOA_LW_up)]/(SFC_LW_up) = 1/3.
With CERES EBAF Edition 4.2.1 (Oct2000-Sep2024) data, g(clear-sky, CERES) = (398.9233 – 265.9824)/398.9233 = 0.33325.
Recently, data were published from global energy and water cycle assessments by Stephens et al. (2023, BAMS) on 30 years of the GEWEX mission. Their data are for all-sky, therefore only equations (3) and (4) may be controlled, with LWCRE taken from an earlier study of the same authors (Stephens et al.2012) as 26.7 Wm-2. According to Fig. 2 of the GEWEX study, net radiation at the surface (RN) equals the sum of the convective fluxes: latent heat (evaporation) and sensible heat. Using data from Fig.SB3,
Eq. (3) RN = LE + H = "Evaporation" + "Sensible heat" = (“Outgoing LW” – LWCRE)/2
81.1 + 25.4 = (239.5 – 26.7)/2 + 0.1 [Wm-2]
Eq. (4) RT = “Surface SW” – “Surface Reflection” + “All-sky emission” = 2 × “Outgoing LW” + LWCRE
184.0 – 23.3 + 345.1 = 2 × 239.5 + 26.7 + 0.1 [Wm-2]
On GEWEX data, both all-sky equations are valid within 0.1 Wm-2.
Joint justification of the governing equations by two independent projects: the global energy-water exchange observation program at the surface and the space-born observations at TOA show the reliability of both the GEWEX assessment and the CERES satellite meteorology mission in one key achievement of recent decades, allowing us to improve and upgrade the theory by the four validated direct surface-TOA coupling equations. Note that the equations have a peculiar feature: a solution in small integer ratios, identical to the observed ones in global energy budgets; see CERES_STM_presentation.pdf and References.
References
Stephens, G. (2003) Colorado_State_University_AT622 Section6, Eqs. (6.10a)-(6.10b), Example 6.3, Fig. 6.3a, https://reef.atmos.colostate.edu/~odell/AT622/stephens_notes/AT622_section06.pdf
Stephens, G. et al. (2012) An update on Earth's energy balance, https://www.nature.com/articles/ngeo1580
Stephens, G. et al. (2023) The First 30 Years of GEWEX, https://journals.ametsoc.org/view/journals/bams/104/1/BAMS-D-22-0061.1.xml
Zagoni, M. (2024) Modeling and Observing Global Energy and Water Cycles by GEWEX. AGU-Fall_Meeting-2024. https://agu.confex.com/agu/agu24/meetingapp.cgi/Paper/1535956
Zagoni, M. (2025) Trenberth’s Greenhouse Geometry. AMS-Annual_Meeting_2025-New_Orleans. https://ams.confex.com/ams/105ANNUAL/meetingapp.cgi/Paper/445222
Zagoni, M. (2025) A Constraint on Convection. AMS-Annual_Meeting_2025-New_Orleans. https://ams.confex.com/ams/105ANNUAL/meetingapp.cgi/Paper/446389
Zagoni, M. (2025) Theoretical reference estimate for the components of the global energy balance. Accepted Abstract EGU2025 General Assembly, Vienna. https://earthenergyflows.com/EGU25-1-print.pdf, see also Supplementary_Material_Brochure.pdf, complement to my planned CERES_STM_Presentation.pdf
See https://earthenergyflows.com; also the updated Supplementary Material video: https://www.earthenergyflows.com/Zagoni-EGU2024-Trenberths-Greenhouse-Geometry_Full-v03-480.mp4
***
 - Indicates paper has been withdrawn from meeting
 - Indicates an Award Winner