
A model for penalizing over- and under-forecasting of inventory was proposed, with a unit profit made for each item sold and losses applied to mis-estimations of inventory. The per-item loss-to-profit ratio L/P for inventory mis-estimates was an adjustable model parameter. A model was proposed that selected the inventory level that maximized profit based on the forecast. Profits were evaluated from models that related the sales to observations, to climatology, to a control forecast member, to an ensemble mean, and to a perfect-prog ensemble mean. Adjustable factors in the model include aspects of the weather climatology such as seasonal climatological variability, the correlation between sales and deviations from the annual mean climatology; the correlation between forecasts’ and observations’ deviation from the seasonally dependent climatology.
Improvements in profit from using weather data in inventory management were modest. Using best-case observations for modeling inventory, profits were larger when L/P was small, but relative profit improvement compared to management using climatological forecasts were larger in the presence of larger L/P. Ensemble-mean forecasts provided improved profits relative to control forecasts, with the relative improvement largest when forecast skill was smallest. Inventory decisions based on ensemble forecasts were improved relative to decisions based on climatology, moreso when forecast skill was high.
Figure : Profit based on inventory management using observed and climatological data. Only positive profits are plotted. Profits are shown as a function of the loss-to-profit ratio L/P for (a) continental, and (b) temperate climates, using three levels of correlation between the deviations of sales and observations from their yearly means.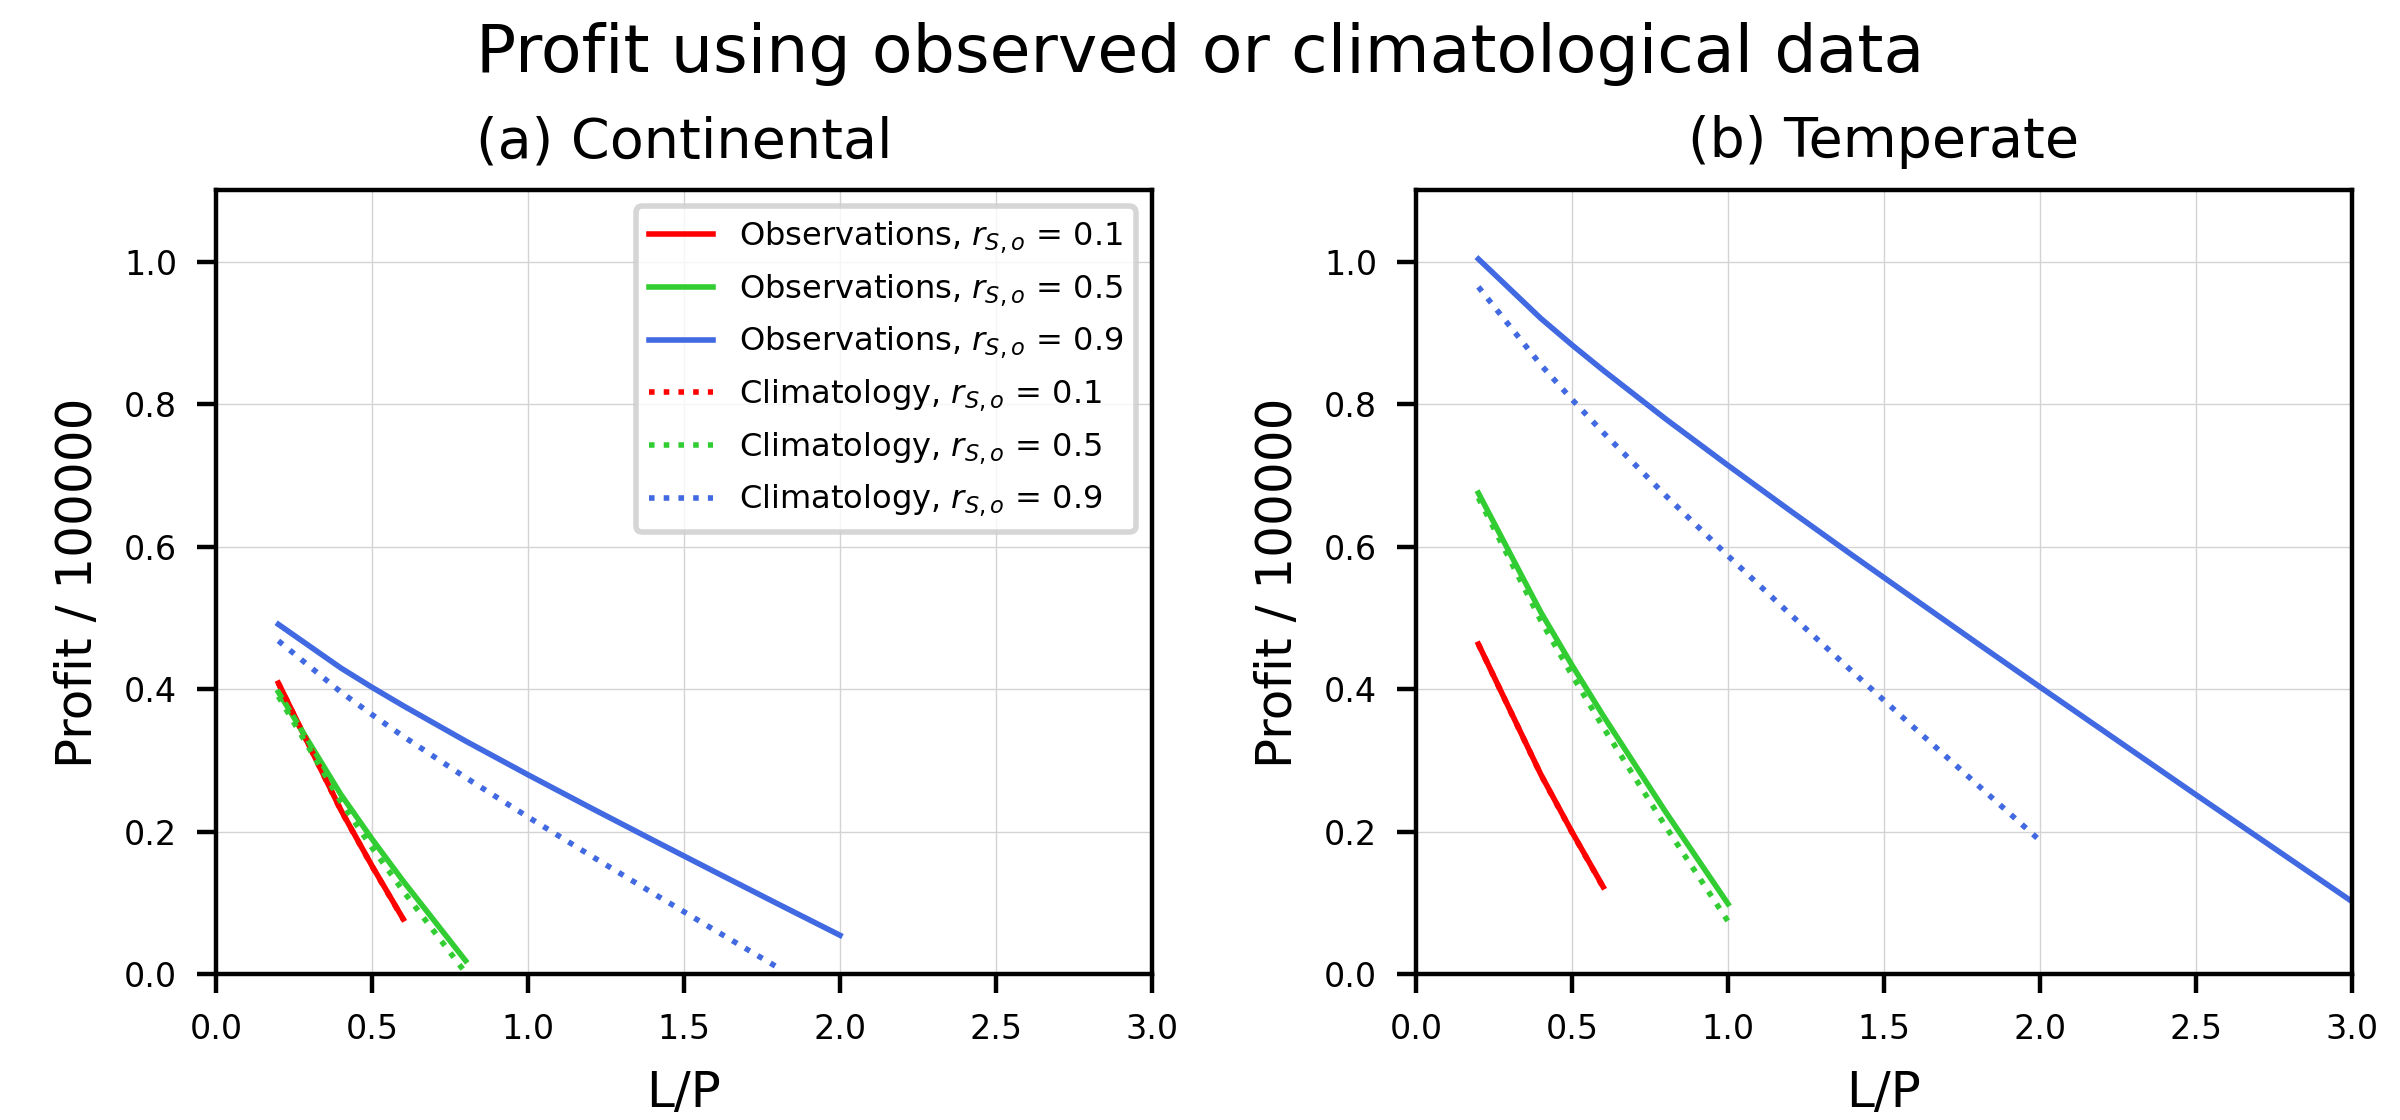
 - Indicates paper has been withdrawn from meeting
 - Indicates an Award Winner