
The underlying factors contributing to the increased lightning strikes on taller WTs are well understood and multifaceted. There are two broad categories of lightning strikes to tall structures: downward cloud-to-ground (CG) strokes and upward discharges that initiate from the structure itself. The strike rates of each type during the convective season scale with local ground flash or strike point density. The constant of proportionality that relates the local flash density to the strike count is termed the collection area. An accurate understanding of the collection areas for each type is crucial for characterizing how lightning strike rates vary with WT location and height. Additionally, the distribution of electrical current parameters differs between downward and upward discharges, so understanding the ratio of each is crucial in robust LPS design.
Several researchers have proposed various empirical and numerical models for the collection areas of each type of lightning strike. However, these models rely on a limited number of empirical observations, with much of the reference data derived from stationary towers rather than WTs. In this study, we present a novel statistical analysis method that leverages data from a national-scale lightning detection network in conjunction with the US Wind Turbine Database (USWTDB) to measure the effective average collection areas for both cloud-to-ground strikes and upward discharges from WTs. Using nine years of lightning location data and 67,565 turbines, our analysis refines previous empirical characterizations. The figure shows our observed collection areas for CG strokes and upward discharges, normalized to 1 ground flash per square kilometer per year. The collection areas are measured across five total tip height ranges. The observed data are compared against regression fits published by Eriksson (1987) that are derived from tower measurements and crude ground flash climatology estimates. The upward strike rates show a close match across the height ranges seen in current WT installations, whereas we observe fewer CG strikes than is predicted by the Eriksson model in WTs on the lower end of the height range. However, long-range lightning locating systems miss over half of upward discharges, allowing us to confidently scale up the observed upward strike rate measurement. The net effect is that previous models likely overestimate the total strike rate for smaller WTs and underestimate the strike rate for taller WTs due to the under-counting of upward discharges.
References:
AJ Eriksson. The incidence of lightning strikes to power lines. IEEE Transactions on Power Delivery, 2(3):859–870, 1987.843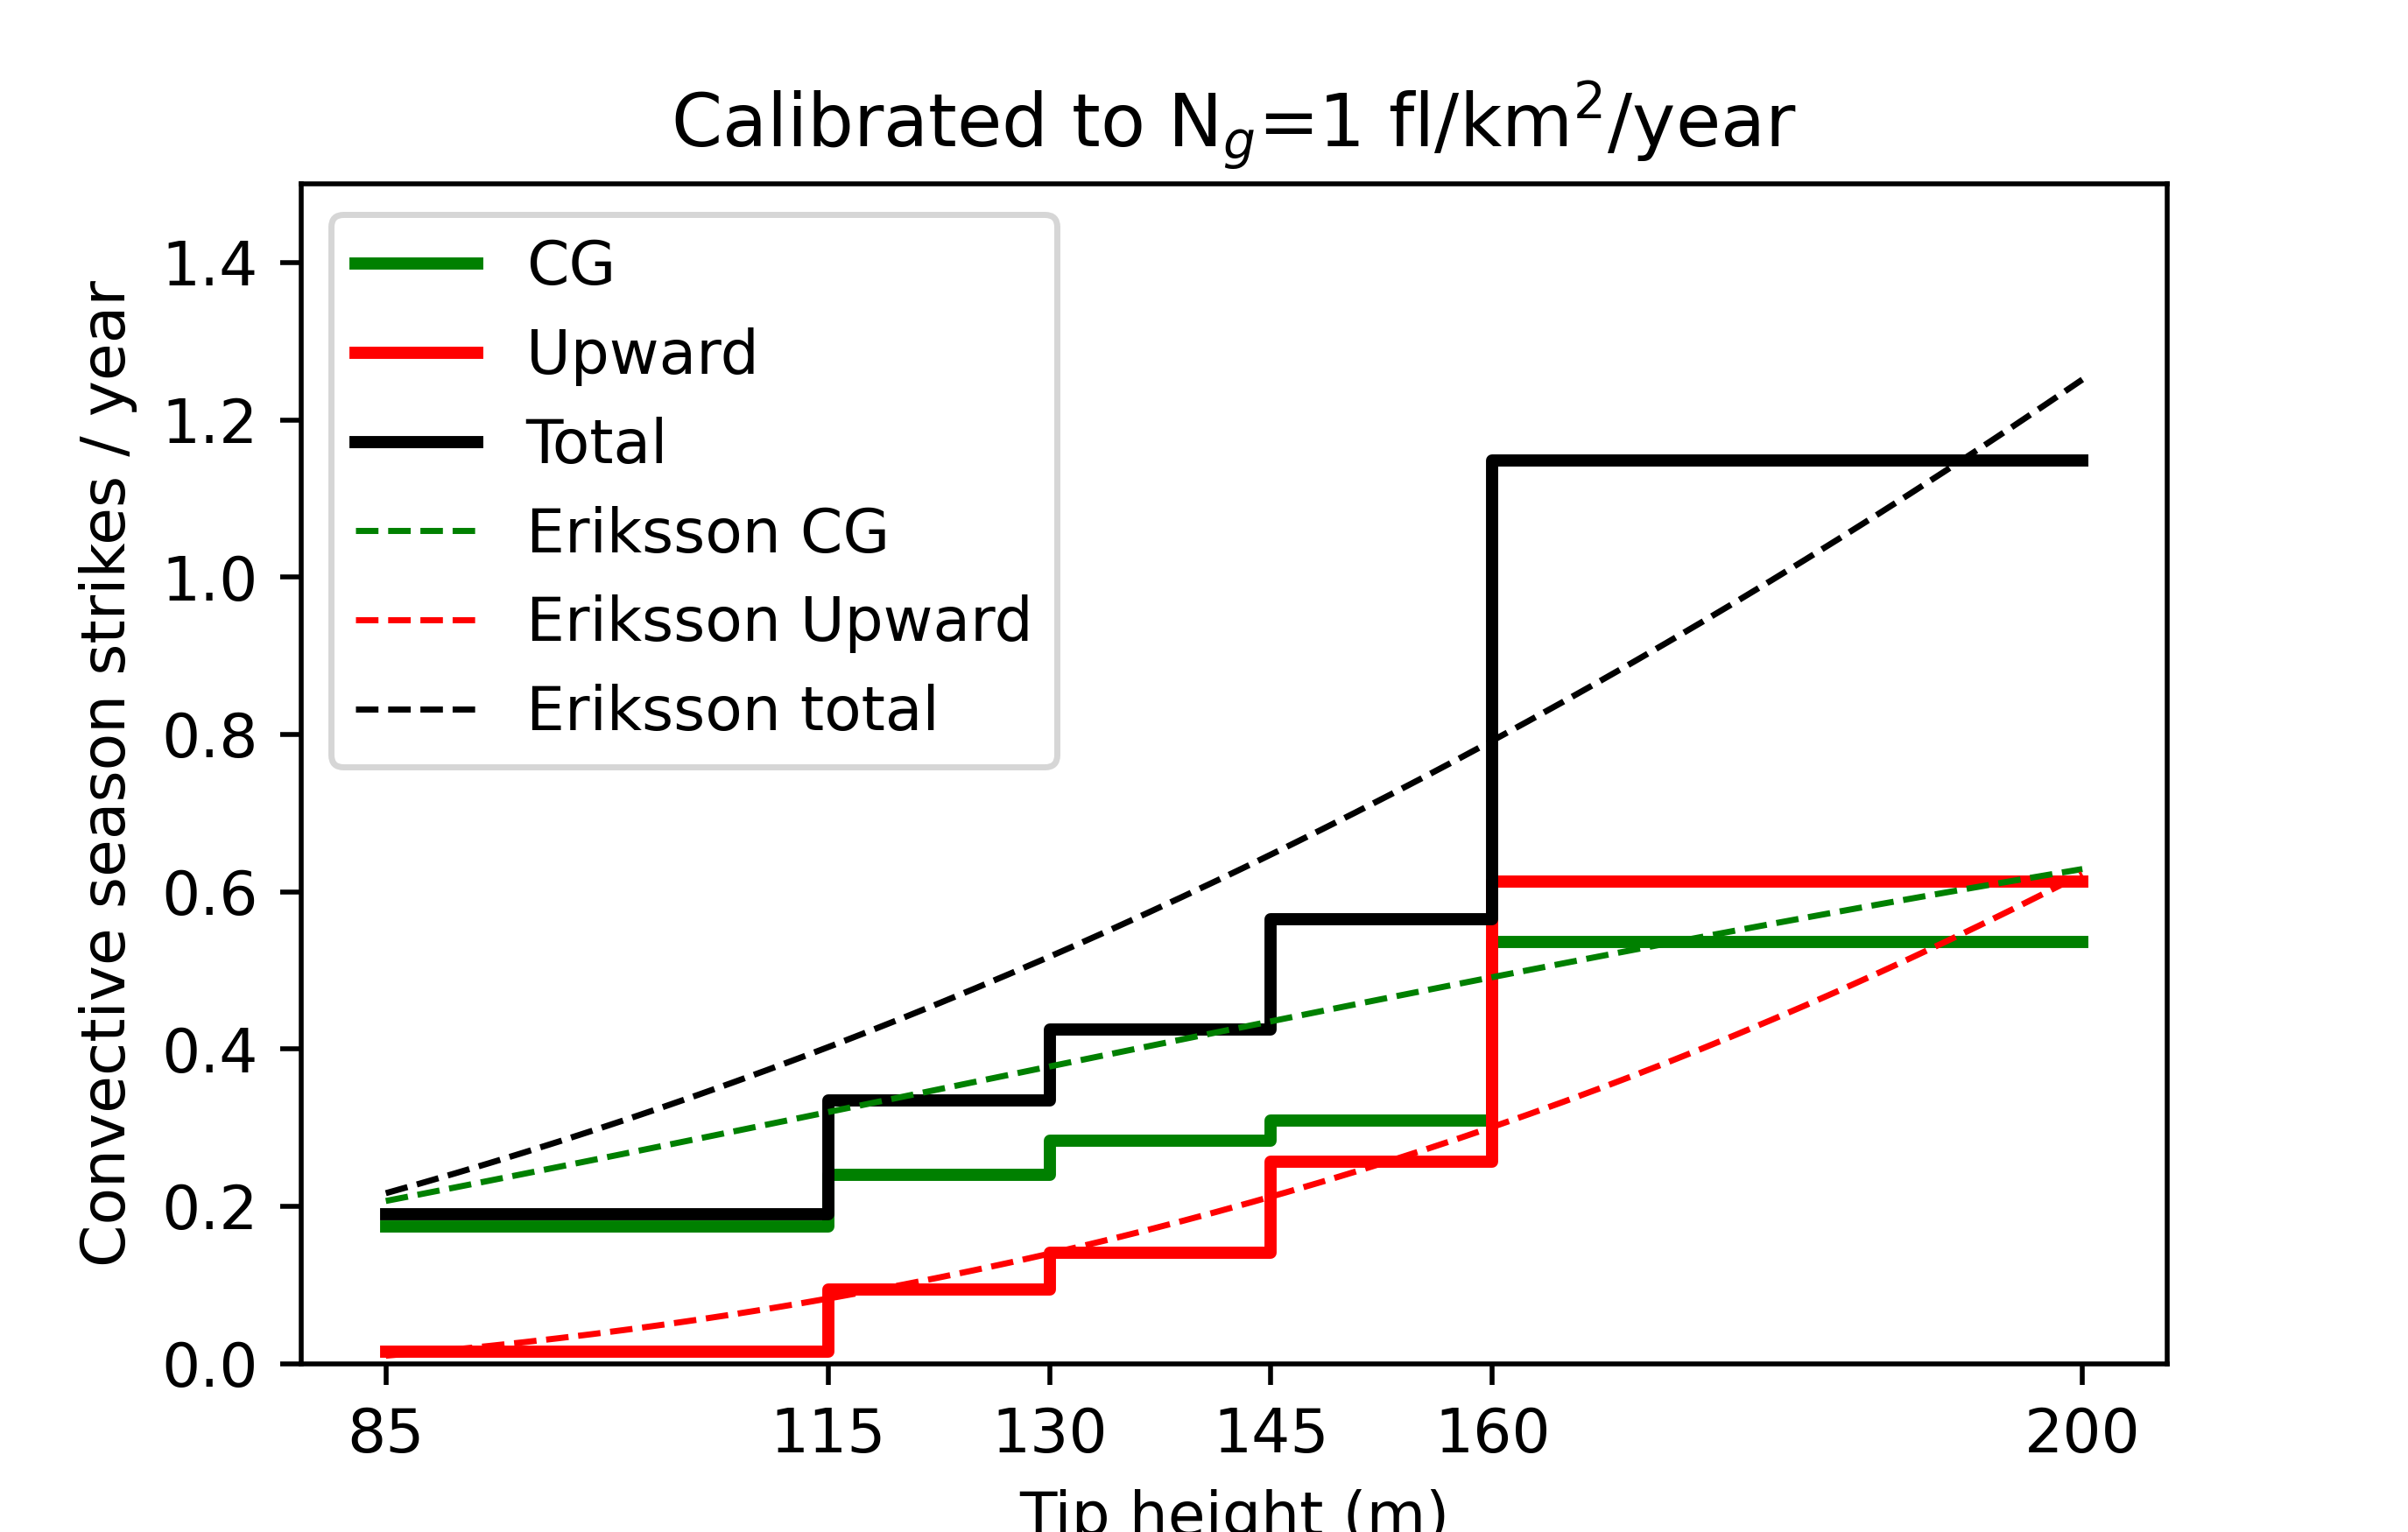
 - Indicates paper has been withdrawn from meeting
 - Indicates an Award Winner