
- INTRODUCTION
Heat islands are urbanized areas that experience hotter temperatures than underlying areas (EPA 2024). These rising temperatures can be due to a multitude of things, such as the absorbance and re-emittance of heat through building materials, road and walking surface materials, and environmental characteristics which lack green space and/or water bodies. While these materials and the lack of natural characteristics have an effect on temperatures, the levels of particulate matter should also be considered. In order to gain insight as to the role that PM plays in the thermal signature of a localized urban area we have investigated these environmental signatures at the neighborhood scale in Albuquerque, NM.
- METHODOLOGY
Albuquerque, New Mexico is home to 561,008 residents, and covers 187.7m/s of land and 1.8m/s of water. Albuquerque sits at a high desert with an elevation of 5,312 ft. With an average of 310 days of sunshine and approximately 9 inches of rainfall annually, hydration and skin protection is crucial.
This study was designed to investigate temperature differences, as well as understanding particulate matter readings, their origin, and to suggest how to combat the negative effects of these characteristics. The transect study area, referred to as the San Mateo transect, is bound by 4 traffic laden streets as shown in Figure 1. This closed loop 2.4-mile transect walk featured a mix of environments, busy roads and commercial buildings with a lack of green space, a golf course with abundant greenspace, and neighborhoods with mild traffic and moderate greenspace. The transect walks covered an 11-week timeframe, with data collected twice a week, on Sundays and Wednesdays, at 7:30am, 1pm, and 6pm, between the dates May 19th and July 28th, 2024.
During the transect walks, Particulate Matter and meta-data were collected using two sensors. The AirBeam-3 sensor was used to collect Temperature, PM10, and PM2.5. The temperature readings of this sensor read higher than normal because the sensor is housed in a radiation shielded case. Thus, the temperature reading is the internal temperature within the solar radiation case and not the true air temperature. A Kestrel-3000 sensor (ground-truth TAIR) was used for calibrating the raw temperature data from the Airbeam-3 sensor whereby the final corrected temperatures were obtained utilizing the Kestrel and AirBeam temperature data in combination with a mathematical model employing a second-order polynomial curve-fitting protocol. The AirBeam air casting application on our phones also displayed a thermal heat map, where it showed a color-coded visual of how the temperature changed during our walk.
- RESULTS AND DISCUSSION
This study was designed to answer two research questions:
(RQ1): does neighborhood design have an influence on the local air temperature?
(RQ2): How does the level of particulate matter (PM10 and PM2.5) affect localized temperatures and human health?
To visualize and understand how city and neighborhood design and development affects surrounding temperatures (RQ1), a thermal heatmap was created. Figure 2. displays the thermal heatmap of three different times, 7:30am, 1:00pm, and 6:00pm, on our hottest day, June 26th (99° F).
According to the heatmaps and the city/neighborhood development, the blue (indicative of cooler temperatures) shown in the heatmap for the morning is due to where the sun is rising and how the building structures shade this part of the road. For the afternoon and evening, this transect does not provide adequate shading or protection from the sun, and therefore the heat map has a solid red color (indicating warm temperatures) throughout the area.
Figure 3. displays a time-series plot between May 19th and July 28th, for morning, afternoon and evening temperatures. According to the time-series, the hottest temperatures were recorded in the afternoon and the coolest temperatures were recorded in the mornings. Some days are missing evening temperature readings due to severe weather. The hottest day recorded was June 26th (T-Afternoon 99°F) and the coolest day recorded was June 23rd (T-Afternoon 81°F), just three days apart.
To address RQ2, and how particulate matter affects the temperature of the area, we studied the average Particulate Matter readings over the same timeframe. Figure 4. shows the timeline of particulate matter between June and July. The average PM reading was between 0-10µm mainly due to vehicle operation and dust storms. On July 24th, the PM data read between 15-30µm due to a nearby grilling event. We were initially anticipating that PM would be saturated around busy roads and main streets, however this was not the case. Dust storms and burning smoke spiked our readings. Although the readings for July 24th have shown a significance in PM readings, this does not seem to have affected the temperature reading of that day.
- CONCLUSIONS
Our results have determined that inadequate city planning, and poor neighborhood design and development caused the transect area of San Mateo to be extremely hot, with little to no source of shade or shelter from the sun. We have also determined that PM readings indicate that burning smoke and dust storms may pose an increased risk to human health as it deposited more particulate matter than vehicle emissions. Although vehicle emissions and PM affect pollution in general, it was found that burning smoke and dust increased the affection. This conclusion could be due to the varying differences in regulations of burning smoke and vehicle emissions.
References
Keenan, Tim. “At What Price Ppm?” Wards Auto 100, 1 Apr. 1996
Grilling with Charcoal Is Definitely Not an Indoor Pursuit! - BfR.
Inhalable Particulate Matter and Health (PM2.5 and PM10) | California Air Resources Board.
“Particulate and Gaseous Emissions from Charcoal Combustion in Barbecue Grills.” Fuel Processing Technology, vol. 176, July 2018, pp. 296–306.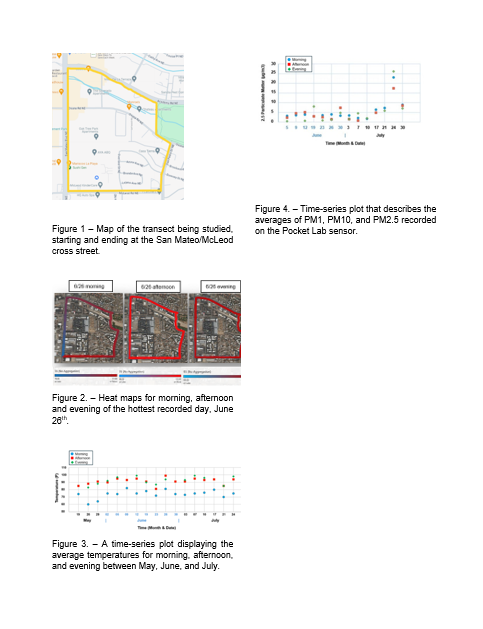
 - Indicates paper has been withdrawn from meeting
 - Indicates an Award Winner