
1. INTRODUCTION
The urban heat island effect (UHIE) is indicative of higher temperatures in urban areas than in rural surrounding areas. This has the effect of causing abnormal precipitation within (Manisha Ganeshan, 2013) and downwind of large urban cities (Changnon, 1968). This means a lower accumulation of precipitation for urban areas, and higher accumulation of precipitation for outlying rural areas that exist downwind of these urban centers (Changnon, 1968). UHIE also affects precipitation by creating localized modified rainfall in locations prone to the UHI effect due to urbanization. To understand the UHI effect we chose a highly urbanized area to evaluate the rainfall modification effect.
2. METHODOLOGY
This study was designed with the purpose of analyzing the urban heat island - modified convective precipitation events (UHI-MCPE) that in a heavily commercial area in Albuquerque. The study area (Figure 1) was primarily composed of public spaces around the perimeter of the Coronado Mall and the Uptown Shopping Center. These public spaces are primarily composed of asphalt parking areas, and concrete sidewalks. There are small green spaces with mostly smaller trees, some large trees, and small foliage. The amount of concrete and asphalt surfaces are composed of an estimated 95% of the overall surface areas surrounding the buildings. For the scope of our study, we designed a two-mile closed loop transect with thirteen stations (see Figure 2), five minutes walking distance from one another. At each of the stations, environmental data was collected using three sensor devices. The AirBeam 3, PocketLab Air, Kestrel 3000, and Thermoworks IRK-2 IR Thermometer. The AirBeam and Kestrel sensors were used to collect air temperatures. The Kestrel also collected wind speedsand the PocketLab collected barometric pressures. The data collection took place from May 27, 2024, and July 24, 2024. In addition, we used a HOBO MX2300 Station, which was installed in Tijeras, about 15 minutes outside of Albuquerque. An existing weather station was also located near our transect location, named San Pedro and Uptown (LoboNet) Weather Station (courtesy of UNM at the transect site), that monitors data on wind speed and precipitation rate.
3. RESULTS AND DISCUSSION
This study was designed to answer two primary research questions.
- Is there a UHI effect occurring in Albuquerque, NM.
- What effect does it have on the localized precipitation.
Warm season UHIE-MCPE were recorded on June 19, July 17, July 21, and July 24. These were identified by examining the ∆T, which is calculated by comparing the temperature difference between the air temperature at the transect site and our rural HOBO station at the same time stamps. We then analyzed the data for anomalies. UHI-MCPE differs from normal precipitation (Figure 3b), due to a drastic spike in ∆T (Figure 3 a and b). During these four recorded events, there was a spike in ∆T, between 20 and 30 degrees (°F) (Figure 3a). This temperature difference occurred in as little as 15-20 minutes, to as much as 120 minutes, which occurred concurrently with a wind gust front, and immediately followed by precipitation, that cools the ∆T down to normal levels.
The surface temperatures are related to the emissivity index of the asphalt at 0.93 (The Engineering Toolbox, 2024), and the porous concrete is 0.92-0.97 (ThermoWorks), the highest rating is 1.0 for complete absorption of heat and energy. The surface temperatures during the afternoons and evenings, typically when UHI-MCPE occurred, ranged from 120˚F-150˚F (Figure 4), in both the asphalt and concrete. These higher surface temperatures intensify the UHI-MCPE, by creating an updraft of heat which causes convection in the upper atmosphere (Figure 8), which under the right conditions (Ji-Young Han, 2014), causes the precipitation. The atmospheric convection is represented in the graphs by the wind gusts and drops in barometric pressure (Figure 7), that happens concurrently with the ∆T spike and the precipitation. Additionally, particulates and aerosols in the atmosphere create an insulating layer that bounces the heat back towards the earth (Figure 8), causing a feedback loop of heat, and causing the initial spike in the UHI-MCPE. All four of the events captured in the data are similar in the timing and temperature ranges and are distinctly different from normal precipitation (lacking a spike in ∆T).
The UHI-MCPE, recorded on July 24, occurred at 9:00 PM, after sunset, when temperatures should have dropped. However, the weather station collected a 25˚F ∆T temperature spike at the time. Two of the other UHI-MCPE, on June 16 and July 21, had ∆T readings of over 30˚F.
4. CONCLUSIONS
Over the course of our study, we found meaningful evidence that a UHI effect is occurring in Albuquerque and is modifying precipitation on a localized level. The magnitude was approximately 10˚F than expected for this type of UHI-MCPE but was likely due to the substantial volume of asphalt/concrete surface areas and human/vehicle traffic around the site.
Acknowledgements: This work was funded by NSF grant award 2246468.
References
Changnon, S. A. (1968). the La Porte weather anomaly - fact or fiction? Retrieved from AMS American Meteorological Society: https://journals.ametsoc.org/view/journals/bams/49/1/1520-0477-49_1_4.xml?tab_body=abstract-display
Ji-Young Han, J.-J. B. (2014, January 8). Urban impacts on precipitation. Retrieved from SpringerLink: https://link.springer.com/article/10.1007/s13143-014-0016-7
Manisha Ganeshan, R. M. (2013). A multi-city analysis of the UHI-influence on warm season rainfall. Retrieved from Science Direct: https://www.sciencedirect.com/science/article/pii/S2212095513000485
The Engineering Toolbox. (2024, 9 4). Surface Emissivity Coefficients. Retrieved from The Engineering Toolbox: https://www.engineeringtoolbox.com/emissivity-coefficients-d_447.html
ThermoWorks. (N/A). Infrared Emissivity Table. Retrieved from ThermoWorks: https://www.thermoworks.com/emissivity-table/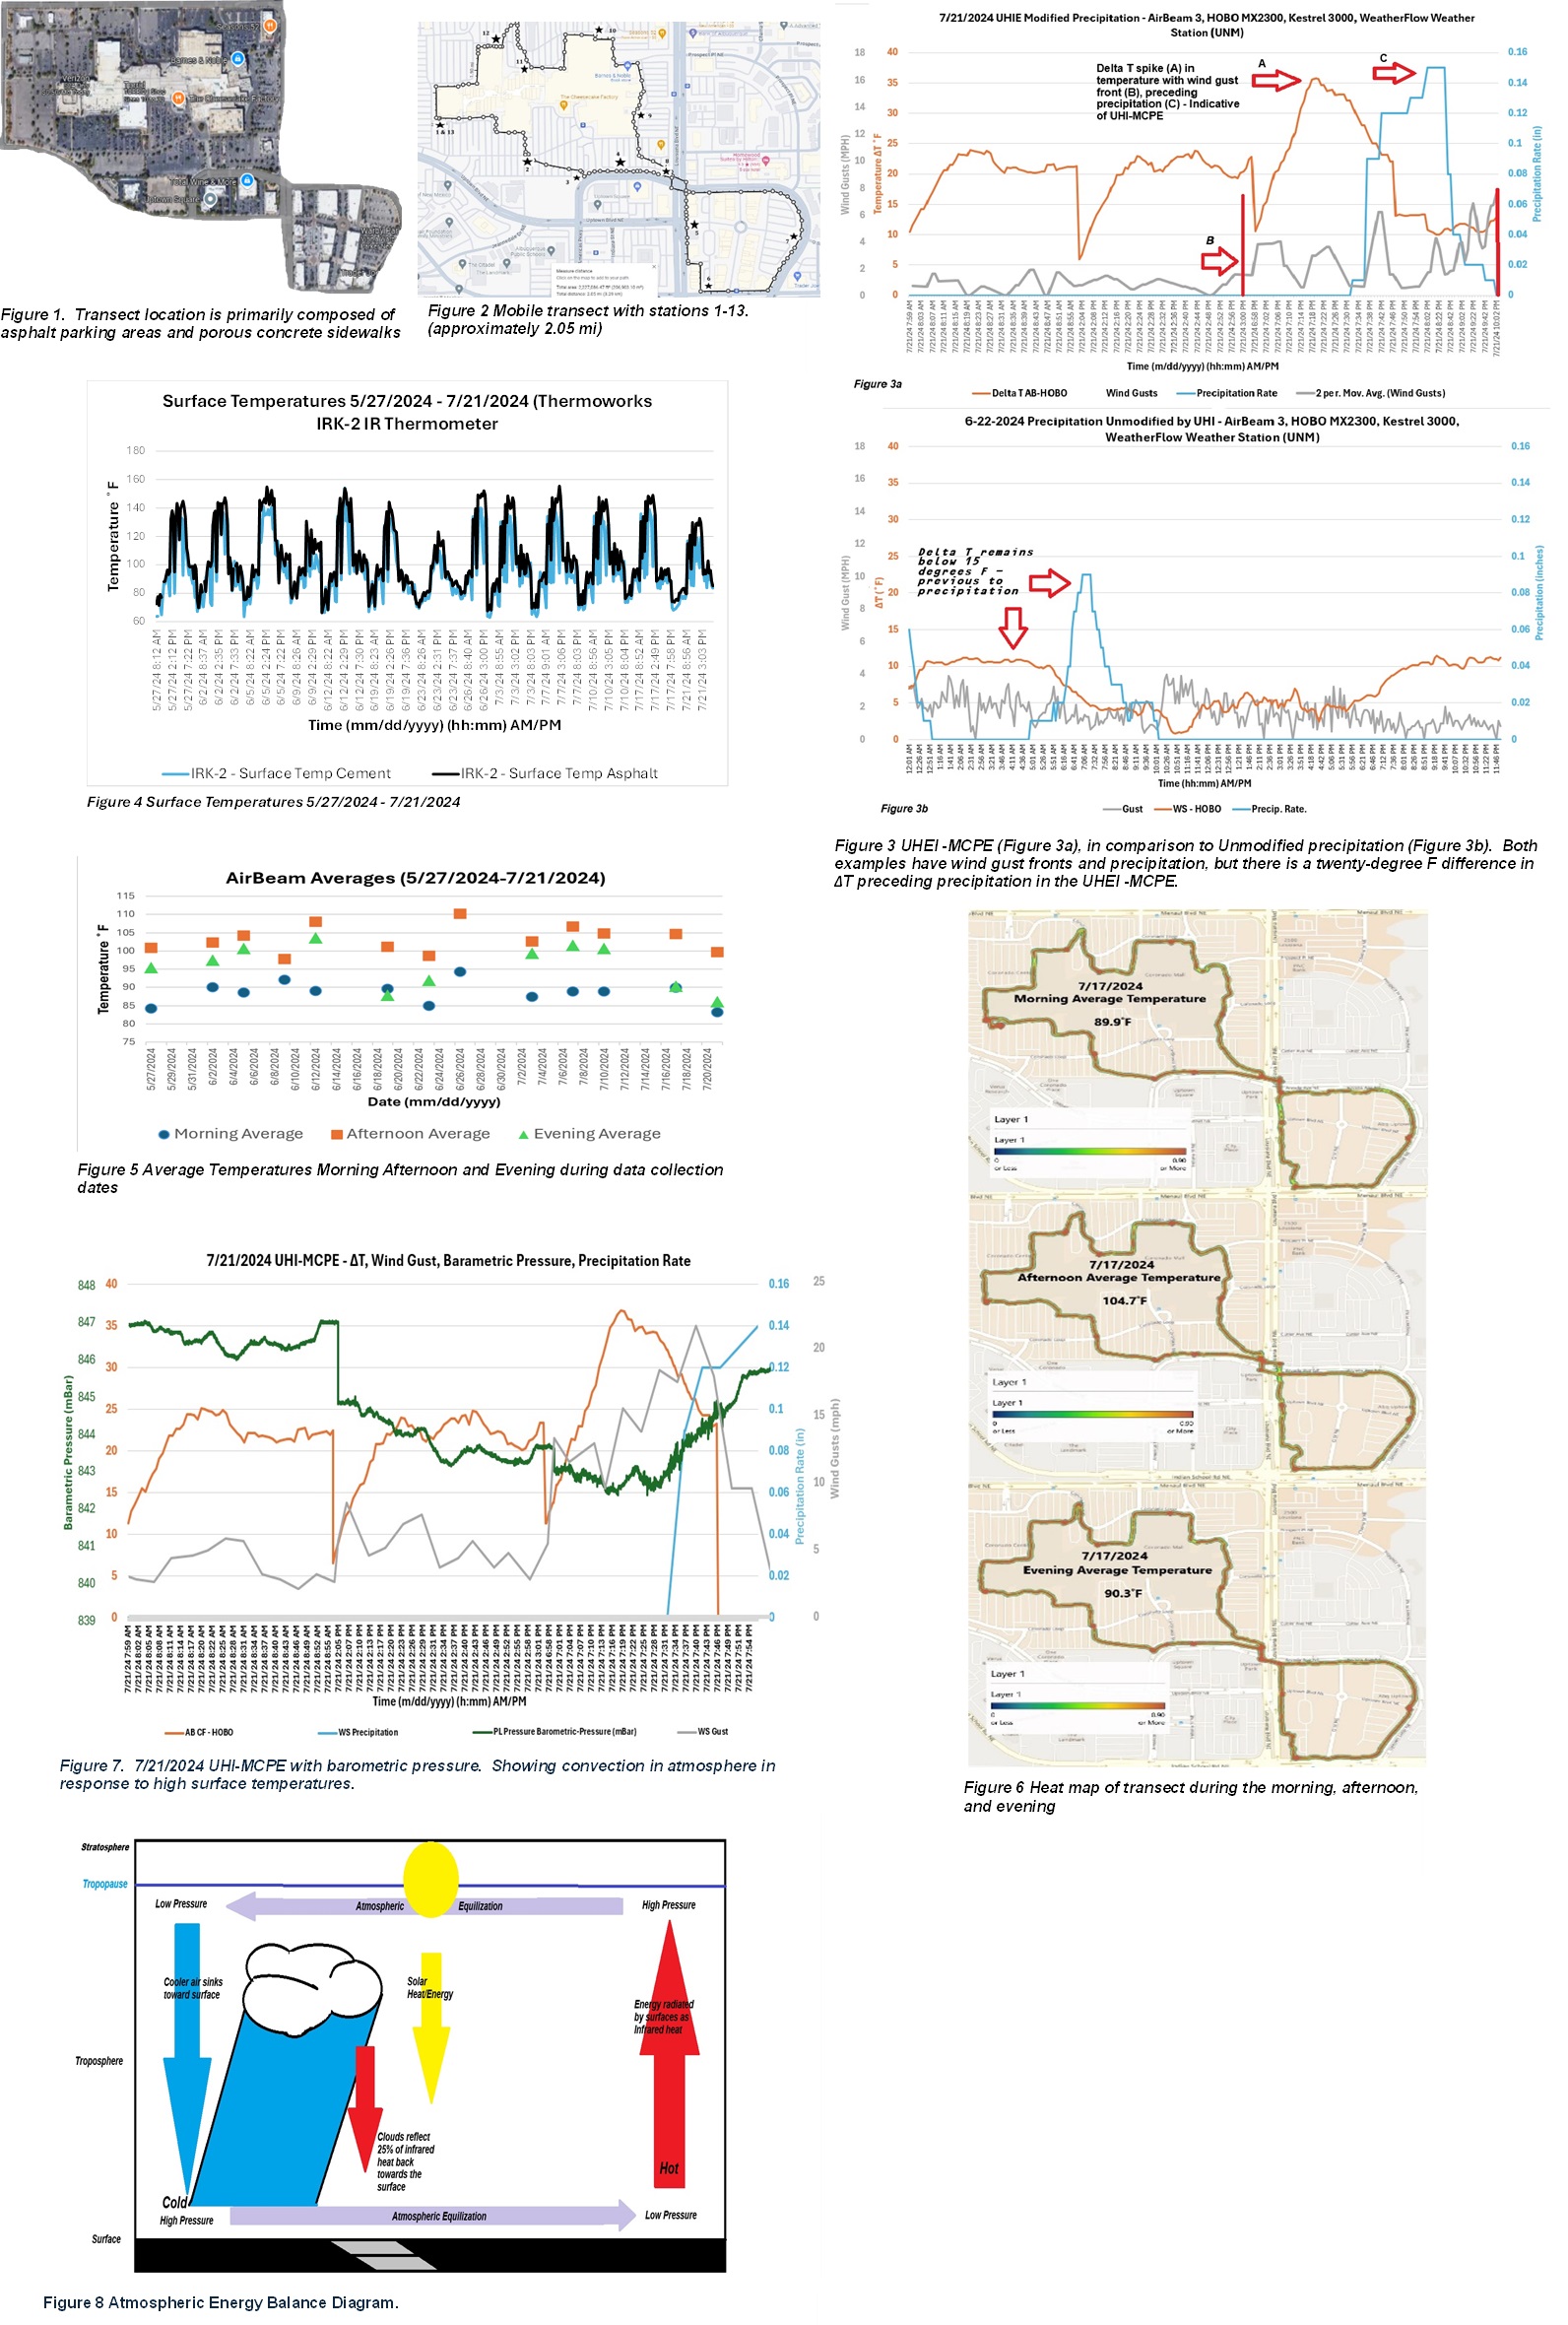
 - Indicates paper has been withdrawn from meeting
 - Indicates an Award Winner