
Handout (1.5 MB)
- INTRODUCTION
The Urban Heat Island Effect (UHIE) is currently affecting multiple cities around the world. The UHIE is described as an increase in temperatures within urban areas in comparison to the rural surrounding areas (Phelan et al. 2015). Albuquerque, New Mexico is classified as an UHI, and the city was thermally mapped as part of the 2021 CAPA Strategies heat mapping campaign (CAPA Strategies, LLC 2021). This one-day mapping effort provided a city-scale thermal-signature of Albuquerque, which demonstrated the existence of localized “hot spots” embedded within the city-scale geospatial domain. To explore the fine structure (localized hot spot(s)) of Albuquerque’s thermal signature, we performed a detailed case-study focused on understanding the UHIE at the local/neighborhood scale.
- METHODOLOGY
The survey site is located on the west side of Albuquerque. This site was selected based on CAPA’s results, which showed a notable “hot spot” with a maximum afternoon temperature of 105°F and an average afternoon temperature of 99°F (CAPA Strategies, LLC 2021). The survey area consisted of a 2.53 mile-long closed-loop with minimal tree covering present (Fig. 1).
The mobile transect method was used to access air temperature (TAir) and the surface temperature (TSurface) of a variety of materials (oriented horizontal/flat lying surfaces and vertical/walls) composed of concrete-composite, sand/gravel, and asphalt. The vertical material structures (walls), measured along the transect, differed in their geospatial orientation along the transect path, e.g., the walls were either north or east facing; there were no south or west facing walls present.
Data was collected for thirteen weeks starting from May 19, 2024, through July 24, 2024. Measurements were taken three times a day (morning: 8-9am, afternoon: 2-3pm, and evening: 7-8pm) on Wednesdays and Sundays using pedestrian foot traffic. Within the study timeframe, there are gaps in the data due to sensor equipment failure and/or user errors. A Kestrel-3000 sensor collected air temperature (TAir) every five minutes. Surface temperatures (TSurface) on concrete, asphalt, sand, north-facing walls, and east-facing walls were measured every five minutes using a ThermoWorks IR sensor. Default emissivity on the sensor is 0.9 and was changed to the correct emissivity for each material according to the manufacturer’s emissivity table.
- RESULTS AND DISCUSSION
This study was designed to answer three research questions (RQs):
RQ #1: Why was the study area considered one of the hottest areas in the city, according to CAPA’s one-day thermal mapping results?
RQ #2: Was the high temperature of the study site correlated to the amount and/or type of man-made materials found in this area, e.g., How does the TAir differ from the TSurfaces in the time domain?
RQ #3: Are there differences in the TSurfaces for the materials measured along the transect and do these temperatures change as a function of their geospatial location?
Fig. 2 shows a time series plot of morning average temperatures for all materials studied during this study. Concrete’s surface temperature followed the air temperature in the morning, with an average TSurface of 1.9°F above ambient TAir. This difference is caused by concrete’s high thermal mass, delaying concrete’s ability to increase in temperature early in the day (Robati et al. 2016). East-facing walls had the largest average of 21.4°F above ambient TAir. This is due to the amount of time these walls are exposed to sunlight and the angle of incidence (angle at which the sun strikes the wall).
Fig. 3 shows the afternoon time-series of the same materials shown in Fig. 2. North and east-facing walls showed the lowest averages above ambient TAir, 2.4°F and 2.8°F, respectively. At this time of day, the walls would release absorbed solar energy, rather than absorbing more energy as they are no longer in direct sunlight. Asphalt and sand held the highest averages, 35.8°F and 31.0°F above ambient TAir, respectively. Asphalt’s high temperature is due to low albedo and high solar radiation during that time of day (Alleman. et al. 2019). Sand generally has a high albedo, however, when paired with high solar radiation and dry soil, it is known to emit large amounts of longwave radiation (Otterman J. 1985).
There is a notable plateau in the data for the evening measurements (Fig. 4). Asphalt remains the hottest material, with an average TSurface of 11.8°F above ambient. Sand has the lowest evening average ambient temperature difference at 1.80°F.
These findings may help to explain the CAPA Strategies data due to the large quantities of asphalt and sand found along the transect. These materials absorb large amounts of solar radiation and slowly release that energy throughout the day.
- CONCLUSIONS
This study measured air and surface temperatures for thirteen weeks in Albuquerque, New Mexico. We found that TAir was significantly lower than nearly all TSurfaces because the materials absorb more solar radiation than transparent air. Differences between the TSurfaces are due to differences in albedo as well as differences in angle of incidence and/or amount of time exposed to the sun. The monsoon season was also shown to have an impact on air and surface temperatures.
References
Alleman, J., Heitzman, M., 2019: Quantifying Pavement Albedo. NCAT Report 19-09.
CAPA Strategies, 2021: Albuquerque NM Heat Watch Report.
Otterman, J., Tucker, C.J., 1985: Satellite Measurements of Surface Albedo and Temperatures in Semi-Desert. Journal of Applied Meteorology and Climatology., 24, 228-235.
Phelan, P.E., et al., 2015: Urban Heat Island: Mechanisms, Implications, and Possible Remedies. Annual Review of Environment and Resources., 40, 285-307.
Robati, M., McCarthy, T.J., Kokogiannakis, G., 2016: Incorporating environmental evaluation and thermal properties of concrete mix designs. Construction and Building Materials., 128, 422-435.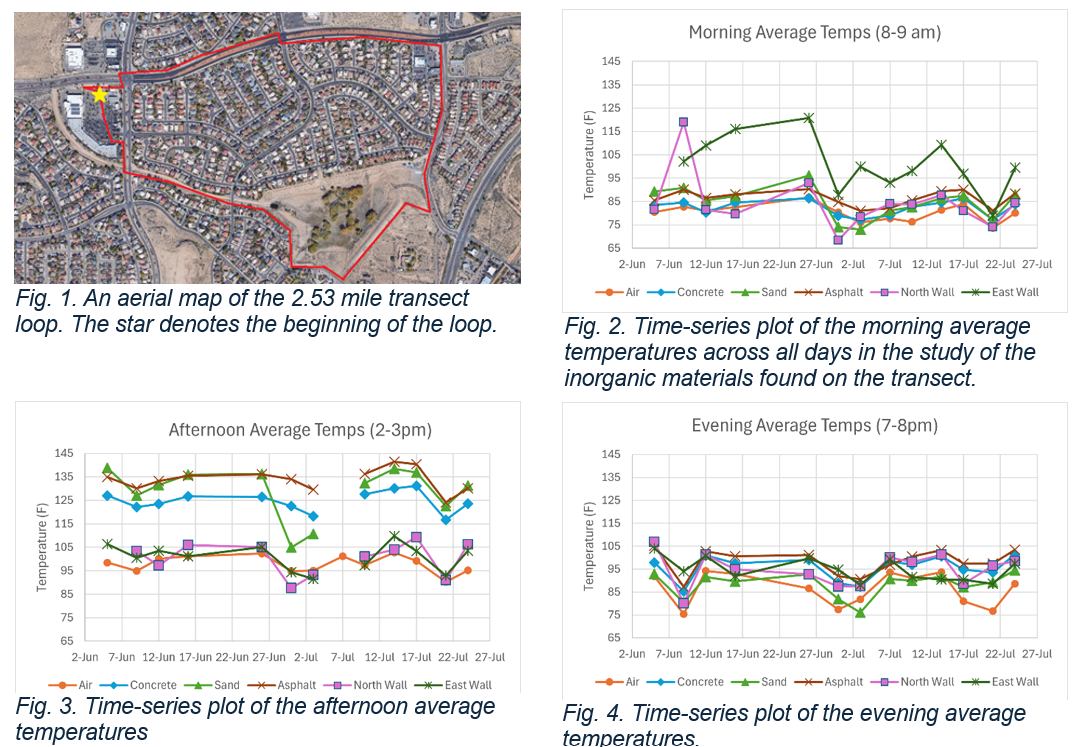
 - Indicates paper has been withdrawn from meeting
 - Indicates an Award Winner