
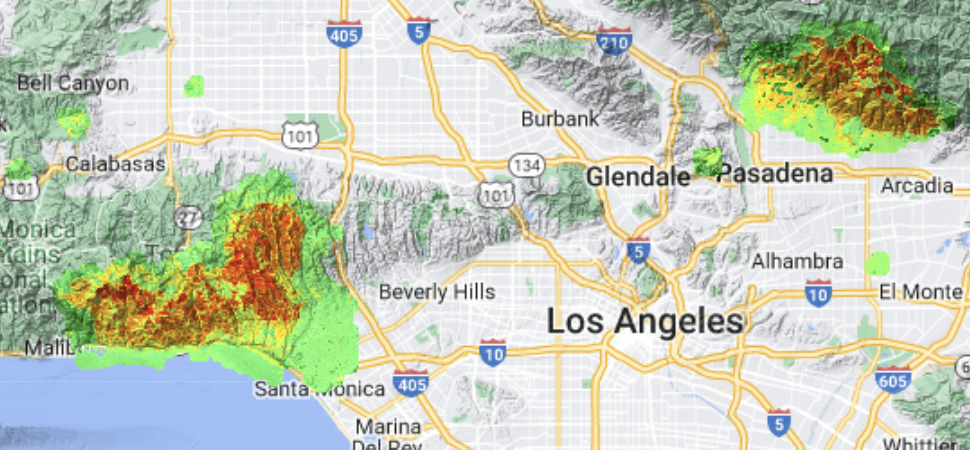
One of the major problems facing forecasters and emergency managers during the response to wildfires is the lack of early and ongoing burn scar information during wildland fire events. This is important since heavily burned areas can be extremely vulnerable to flash flooding and debris flows caused by rain events as soon as fires ignite, especially in regions with steep terrain. This is because the vegetation on the ground that would normally absorb the rainfall and stabilize the soil turns in to an ash layer, which covers an impermeable hardened soil, that can accelerate runoff. With support from NOAA's JPSS (Joint Polar Satellite System program and the Weather Program Office, we have developed a daily BRISK (Burned area Rapid Interim Severity Risk) map to help fill this information gap. The BRISK map is produced by using innovative cloud-computing technology to merge multiple satellite observations combined together to make daily burn scar maps available to responders for fires that exceed 5,000 acres. Each day we use Google Earth Engine (GEE) to organize and merge 96 5-minute CONUS ABI images with up to three daily VIIRS passes and any available Sentinel 2a/b and Landsat 8/9 images. Multi-sensor fusion enables cloud-free compositing of the best available pixels. The result is a daily, BRISK map of the Western United States that we make available to forecasters in AWIPS and to hydrologists, IMETs, and FBANs with ArcGIS and OGC (Open Geospatial Consortium) web services. This presentation will provide a brief overview of the algorithm as well as showing examples of BRISK maps developed for recent fire events in the Western United States, including the deadly Palisades and Altadena fires.
 - Indicates paper has been withdrawn from meeting
 - Indicates an Award Winner