
Handout (1.9 MB)
A number of indices have been introduced in an attempt to standardize the characterization of such a strongly intermittent phenomenon that is the extreme precipitation. Here we focus on only four indices, and assess the utility of the most recent version of the Integrated Multi-satellitE Retrievals for Global Precipitation Measurement (IMERG) daily data to estimate confident regional trends in extreme precipitation. These are identified at 95% confidence level, from the 23-year long record of IMERG. Some of the strongest increasing extreme precipitation tendencies over land are in North America and portions of Europe, during the winter season (December-February). They are best manifested in the simple precipitation intensity index (SDII) and in the maximum 1-day conditional precipitation rate (Rx1day). Similar North American and European patterns of increasing heavy precipitation are manifested by the increasing count of days with precipitation above 10 mm/day (R10mm). The R95pTOT - the contribution of very wet days (precipitation greater than 1 mm/day) that are above the climatological 95th percentile, to the seasonal total - is a telling index that weighs the contribution of the heaviest events to precipitation totals. Customarily, it is used in reference to yearly totals, but here we are interested in seasonal patterns and hence use seasonal totals. Although it shows more incoherent patterns and small relative increases over land, trends of increasing R95pTOT are still identifiable and consistent with those of R10mm, SDII, and Rx1mm. 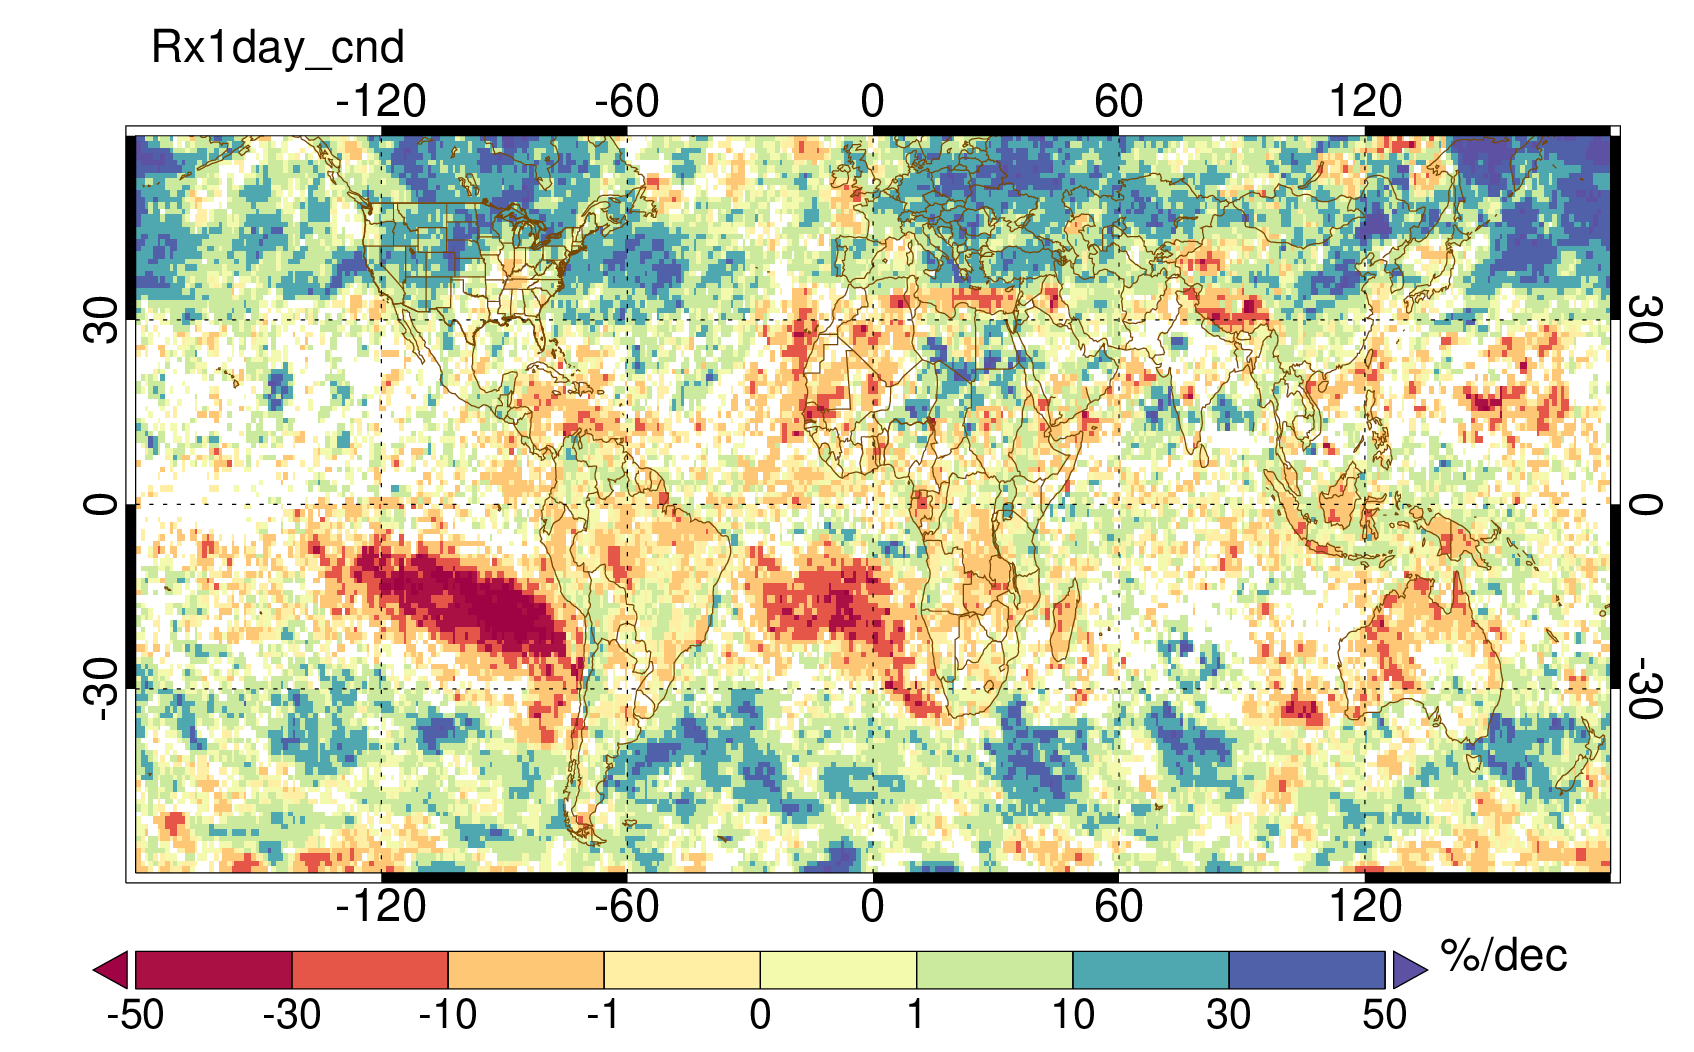
 - Indicates paper has been withdrawn from meeting
 - Indicates an Award Winner